As detailed in one of our recent blogs, movements in interest rates have long been a key driver of gold’s performance, particularly in the short and medium term, as they represent, in part, the opportunity cost of holding gold.
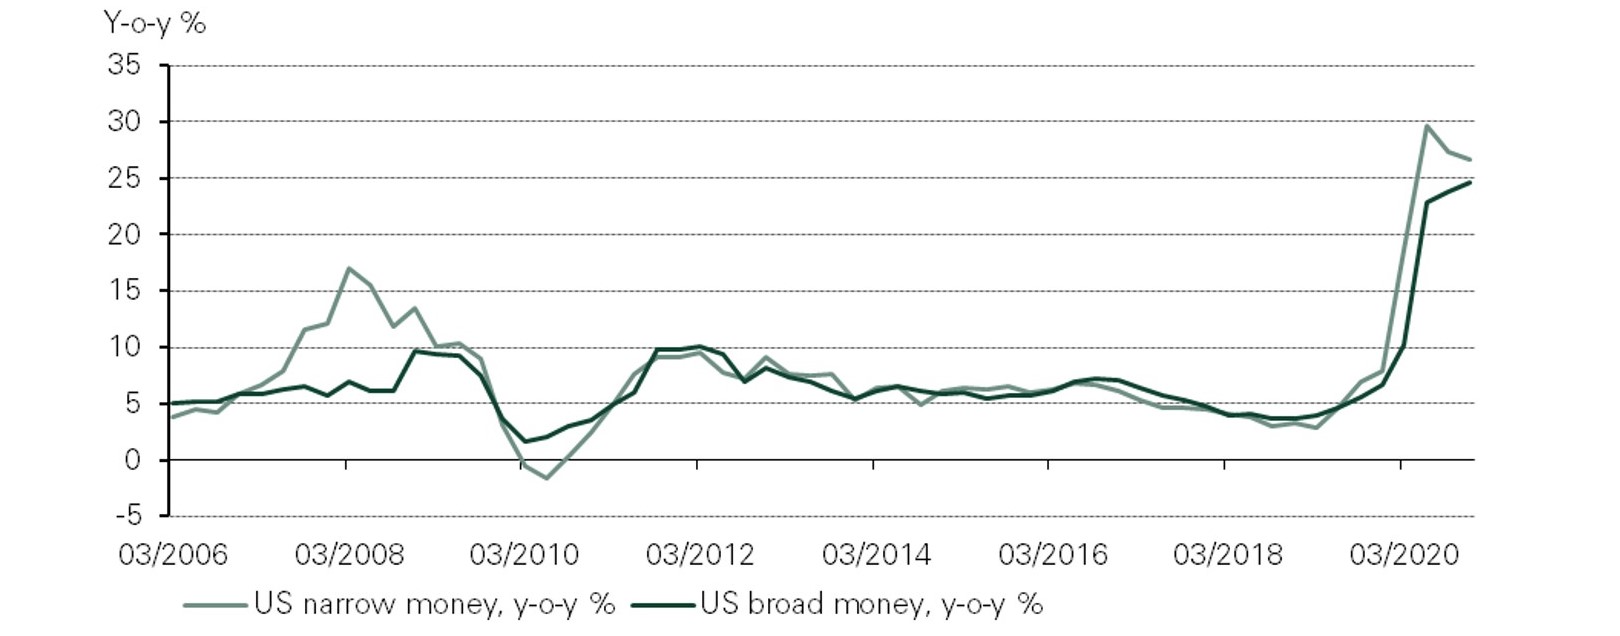
As relevant as they are, however, opportunity costs are generally just one of the four key drivers of gold. Yet, our analysis indicates that over the past year, gold’s sensitivity to interest rates, accounting for other factors, has risen more than four-fold. This period began with unprecedented central bank activity in financial markets, which initially sent bond yields sharply lower worldwide in early 2020. In fact, the extent of monetary expansion during the second quarter of last year stands out even in comparison to the first wave of quantitative easing enacted in response to the Global Financial Crisis in 2008 (Chart 1). As a result, our short-term gold performance model1 showed that interest rates alone explained more than 40% of gold’s price rally to above US$2,000/oz last year.2
Chart 1: Federal Reserve’s balance sheet ballooned in 2020
Y-o-y change in Federal Reserve assets (2006–2020)*
*As of 31 December 2020. Based on US M2 Money Supply and Federal Reserve Zero Maturity Money Supply.
Source: Bloomberg
Given the extreme movement in interest rates led by rampant stimulus in 2020, it was only a matter of time before yields swung back up as investors’ inflation expectations rose. This anticipation of economic recovery coupled with the re-emergence of higher inflation, or ‘reflation’, has pushed up resource commodity prices including oil, while gold performance has lagged. At the same time, gold remains highly sensitive to interest rates, and the degree of its responsiveness to a move in rates has only grown. So far, close to 60% of the decline in gold prices year-to-date can be attributed to interest rates, a contribution more than twice that of any other variable we use to explain gold performance (Chart 2). This comes as 10-year US Treasury yields increased by 50bps over the past two months.3
Chart 2: Interest rates account for almost 60% of gold performance y-t-d
2021 y-t-d gold performance attribution*
*As of 28 February 2021. Calculated using weekly inputs for all variables from 28 February 2020 to 28 February 2021. For more information, see Short-Term Gold Price Drivers | What Affects Gold Prices | Goldhub.
Source: Bloomberg, World Gold Council
To examine gold’s recent increased sensitivity to interest rates, we compared the past year to its relationship with interest rate yields over longer time horizons that incorporated different macroeconomic environments. Currently, our model estimates that gold exhibits an approximate -10% sensitivity to rates, based on its behaviour over the previous 52 weeks ending February 2021. In other words, the portion of gold’s price that is explained by interest rates would decline by 10% for every 1% increase in interest rates, measured by the change in US 10-year yields. Therefore, US 10-year yields moving 50bps higher in the last two months would amount to an approximate 5% decline in the gold price. This accounts for the majority of gold’s 9% decline year-to-date.4 As detailed earlier, over the past year gold’s sensitivity to rates is more than four times greater compared to the full period of the model beginning in 2007, where its sensitivity was closer to just -2.5%.
Looking forward, it is important to note that the heightened sensitivity of gold to interest rates is not just a phenomenon of the past year during skyrocketing stimulus and bond purchases from the Federal Reserve, among other central banks. Gold exhibited a sensitivity of c.-11% based on its behaviour over the previous 104 weeks dating back to early 2019, which indicates that this is likely to be a significant performance driver in at least the medium term as well. In general, gold’s sensitivity to rates increases when the market is paying more attention to what the Fed is doing; whereas, when the market anticipates little change to monetary policy (e.g., when the Fed has signalled continued tightening and the market believes it), other factors become more important.5 In the current environment therefore, while an increase in interest rates may pose headwinds for gold, an increase in inflation expectations may offset some of this impact.
Footnotes
1 Based on weekly inputs to World Gold Council’s Short-term gold price drivers model. For more information please see Short-Term Gold Price Drivers | What Affects Gold Prices | Goldhub.
2 LBMA Gold Price PM reached a high of US$2,067/oz on 6 August 2020.
3 As of 28 February 2021. Based on Bloomberg’s US Government Generic 10-year Yield Index.
4 Based on the LBMA Gold Price PM as of 28 February 2021.
5 See Investment Update: Gold tracks the dollar as rates take a back seat | World Gold Council.


