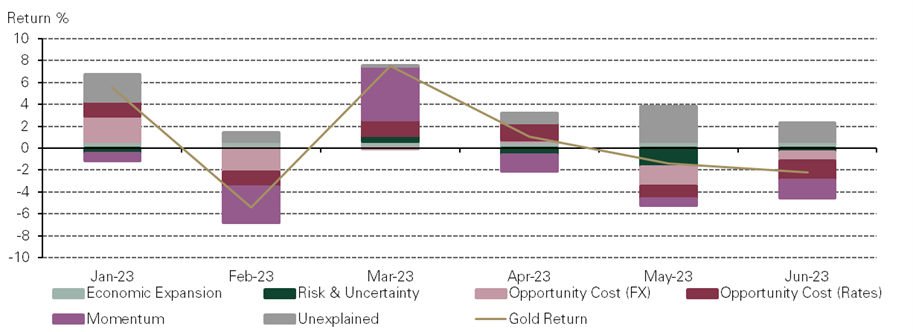
- Gold price weakness in June, according to GRAM, was largely the result of a rise in US Treasury yields, a fall in volatility, US dollar strength and ensuing outflows from global gold ETFs
- Gold’s robust performance in H1 was buffered by central bank buying and event-risk hedging, such as during the mini banking crisis
- The US dollar and bond yields have been less of drag for gold so far in 2023 compared to last year, in spite of some strong moves in the last couple of months.
Our Gold Return Attribution Model, GRAM, is a simple yet insightful statistical breakdown of the main factors driving monthly changes in the spot gold price (in US dollars). It is based on an estimate of gold’s relation to a set of drivers that have been shown to reliably explain its behaviour since 2007.1 We group these drivers into four broad buckets: economic expansion, opportunity cost, risk and momentum.

Source: Bloomberg, World Gold Council. See here for further detail.
June drivers
In June, gold dropped by 2.2%. This was, according to GRAM, predominantly a response to:
- Global gold ETF outflows (-1.7% contribution, momentum bucket)
- A 25 bp rise in US 10-year Treasury yields (-1.8% contribution, opportunity cost bucket)
- A fall in implied volatility (-0.8% contribution, risk bucket).
- US dollar strength, mainly against Asian currencies (-0.8% contribution, opportunity cost bucket)
The GRAM estimated return for June was -3.9% which left 1.7% unexplained by the model.
We generally attribute the unexplained portion to one of two main culprits:2 1) an omitted variable which may not be currently included in our model, or 2) a change in the sensitivities of gold to one or more of the variables used in the model. In June, we believe a change in sensitivity was the more likely cause. The sensitivities in our model represent an average across the full model estimation window (16 years as of February this year), which means that any recent changes only have a small marginal impact on this average. One way around this is to reduce the estimation window to a more recent period, while still retaining enough information, to add more weight to current readings.
If we re-estimate the model over, say, a five-year window, we find that the sensitivity to bond yields, which historically dominate short term gold price movements, is markedly lower.3 In addition, the unexplained portion of the model is reduced to just 20bps. As we highlighted in our most recent Gold Market Commentary, It is possible that investors have been focusing less on changes in the 10-year Treasury yield – associated with longer term growth and inflation expectations and also relatively stable over the past 12 months – and more on shorter maturity yields including the US dollar at zero maturity, associated with either Fed policy or the recent debt-ceiling saga.
H1 drivers
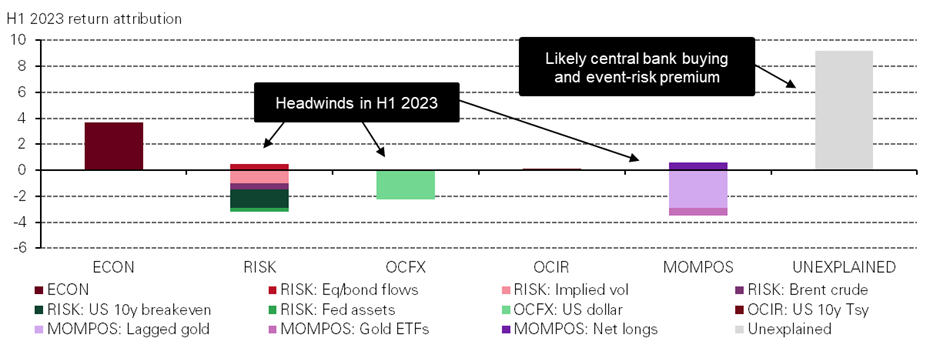
Looking at gold’s cumulative performance in H1,4 our analysis suggests that:
- Despite their elevated levels, relatively steady bond yields did not create further drag for gold
- Support from US dollar weakness against the euro was offset by USD strength vs. JPY, CNY and AUD – Overall however, the dollar’s impact has been lower than in 20225
- A drop in implied volatility, inflation expectations, and a shrinking Fed balance sheet also had a negative effect on gold’s return
- Price momentum and gold ETF outflows pressured gold, particularly in the last two months of Q2
What is also notable is that the model estimated a drop of 4% in the gold price, leaving a sizeable 9% unexplained gap in the estimation over the course of the first half of the year. Reducing the estimation window as above lowers this gap to 5%, so perhaps half of the miss is a change in sensitivities. We believe that much of the remainder is heavily represented by central bank buying and, to a lesser extent, an event-risk premium.6

ECON = economic expansion, RISK = Risk and uncertainty, OCFX = Opportunity cost (FX), OCIR = Opportunity cost (Rates), MOMPOS = Momentum and trends. Attribution covers the first six months of 2023
Source: Bloomberg, World Gold Council. See here for further detail.
The good news for gold is that central bank demand remains healthy and our annual surveys are generally a reliable guide to future buying intentions. So, there is good evidence that central bank demand, which appears to have done a lot of the heavy lifting in generating gold’s very respectable YTD return, will not go away anytime soon.7 In addition, notwithstanding positive economic data surprises and current equity market fervour, recession risks remain and the outcome of unprecedented policy tightening hangs over both the economy and markets like Damocles’ sword. These event risks are difficult to time which is why a strategic allocation to gold is so important.
Footnotes
Our estimation window starts in February 2007 due to data availability. We chose a longer window as our default to capture long-term interactions.
While it’s possible that other estimation or misspecification errors exist, we regularly review the variables we use to ensure that our model is both robust and intuitive.
The sensitivity to the 10-year Treasury yield almost halves and the sensitivity to the US dollar nearly doubles although it is absolutely lower than the yield sensitivity so does not make up for the increase in the unexplained portion. Sensitivities of the other variables do not change materially in a five-year estimation window
The gold price rose by 5.4% in H1 based on the LBMA Gold Price PM as of 30 June 2023. However, for purposes of GRAM, we use the spot gold price, XAU, as it’s timing better aligns with some of the variables used in the model. See GRAM’s Methodology for more details.
Note that the dollar indices in GRAM differ from the DXY index, which has a57% weighting to the EURO. Our indices use equal weights for EUR, JPY, CNY and AUD.
Central bank buying is difficult to capture in our model given the timing of data releases.
Turkyie’s recent sales, although dampening y-t-d aggregate central bank demand, have largely been tactical and a transfer from public to private ownership. See our most recent blog


