Higher gold price eases pressure on producer margins
16 May, 2024
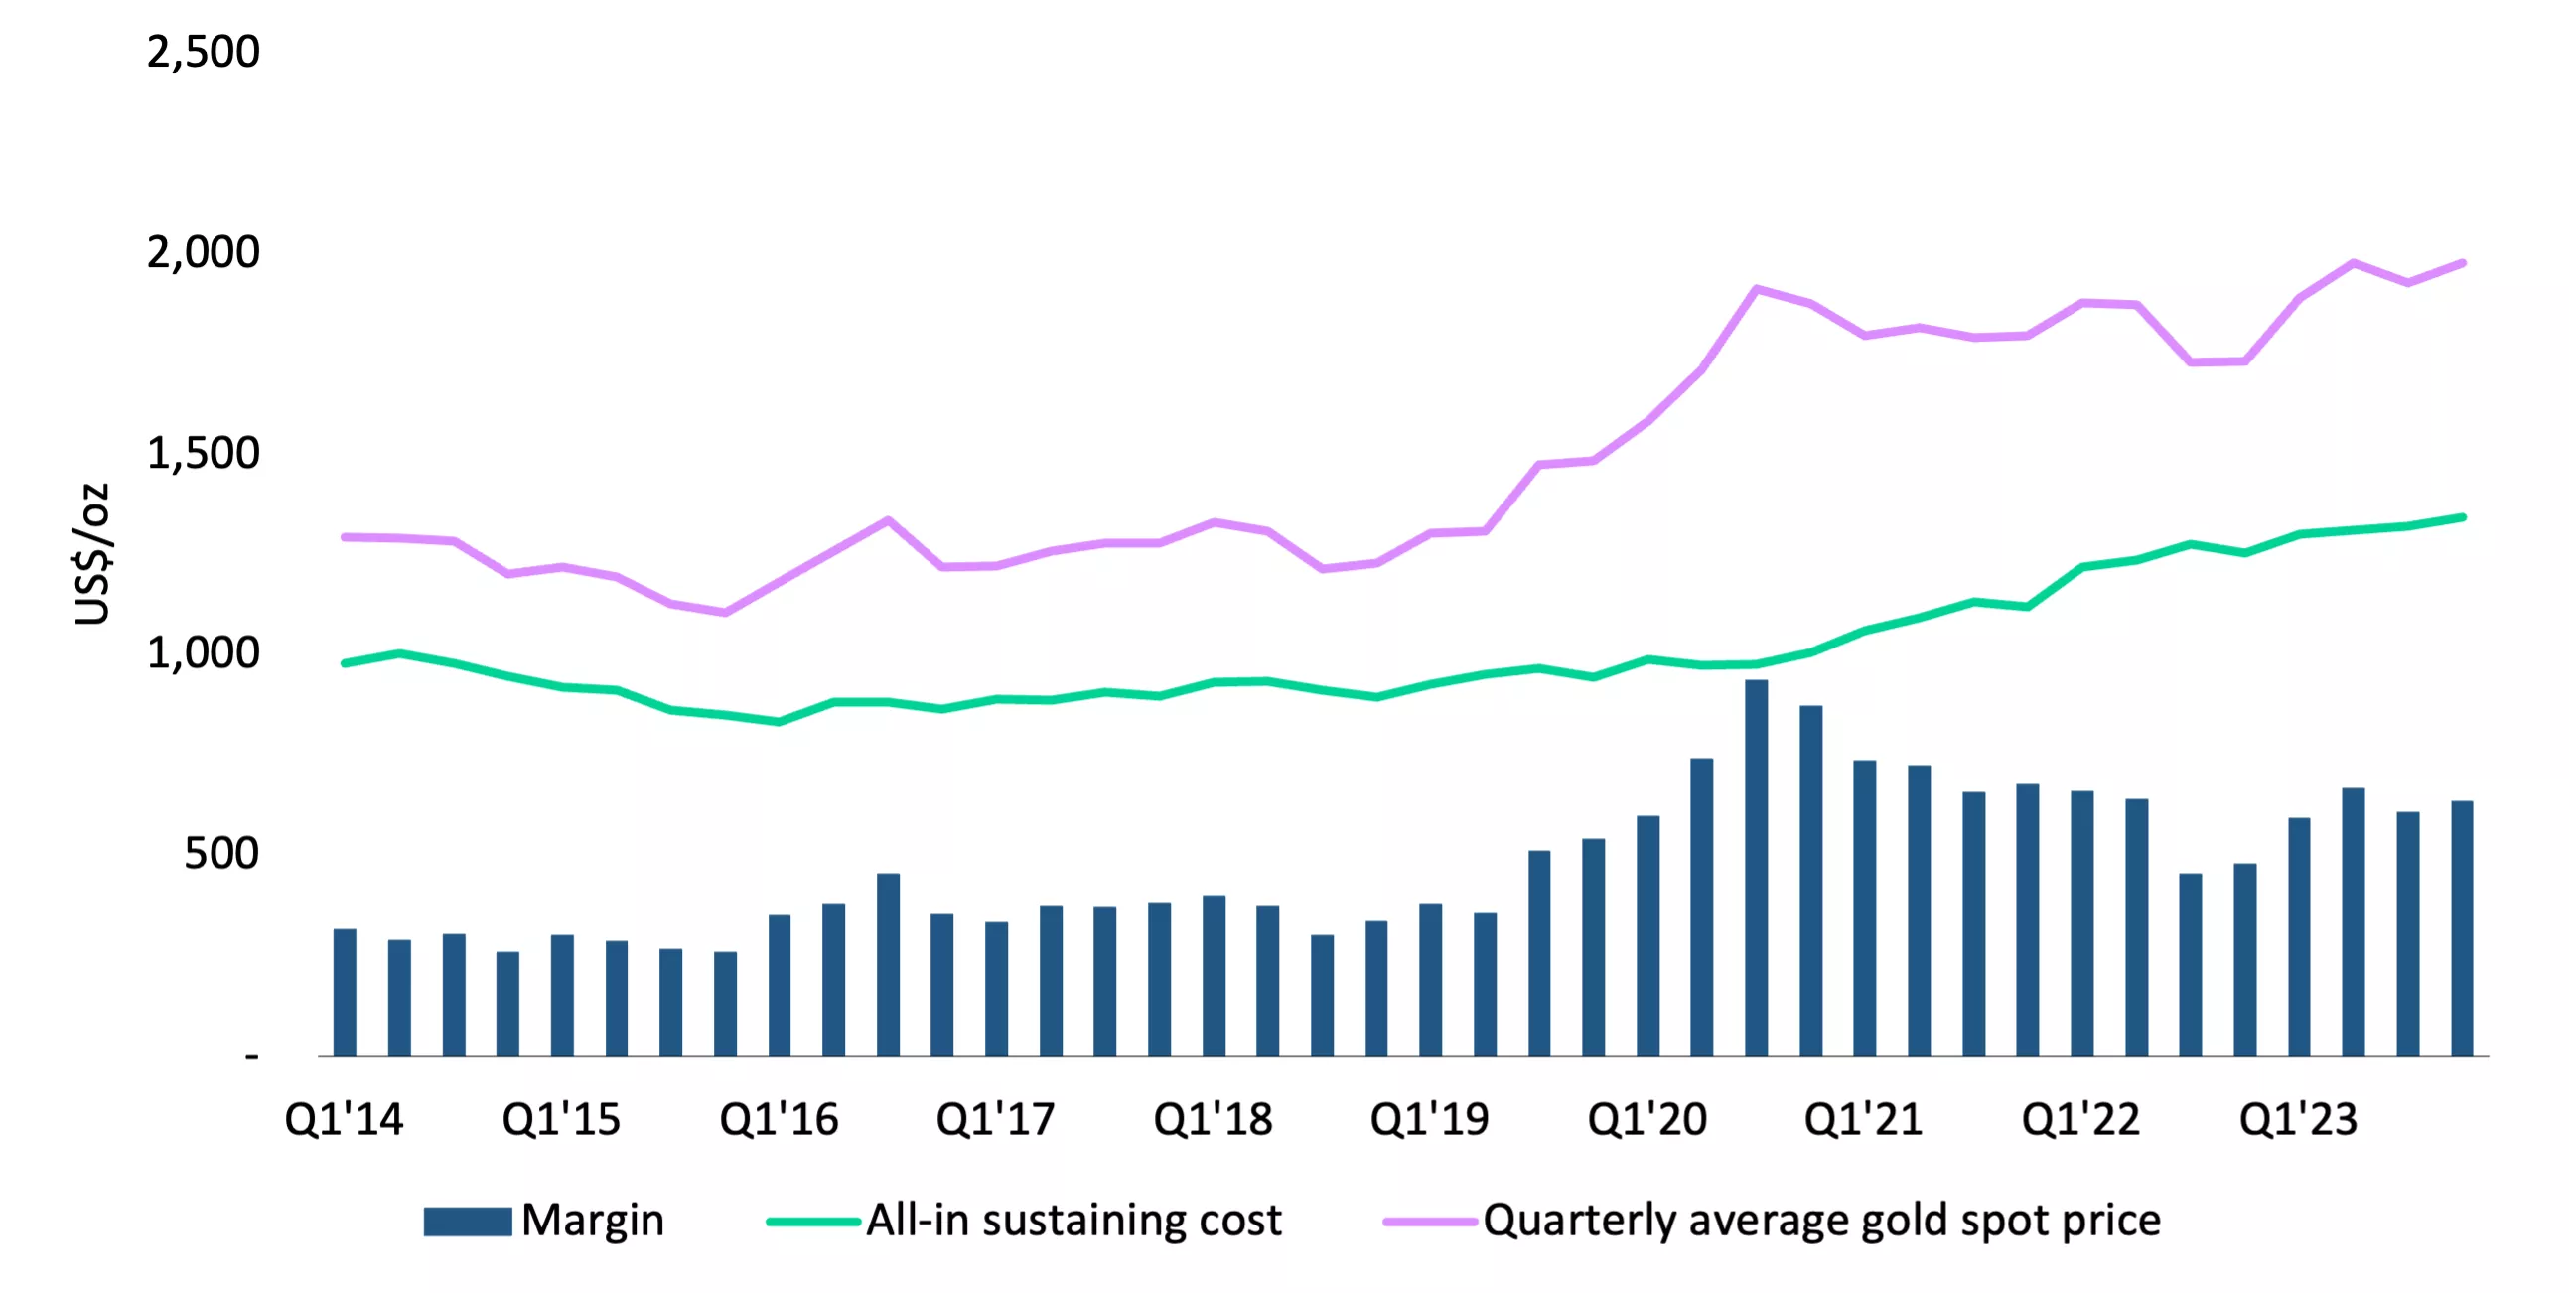
In Q4’23 gold miners’ global average all-in sustaining costs (AISC) rose again, up 2% q/q to US$1,342/oz as persistent cost inflation and a tight labour market continued to influence on-site operating costs. There is a silver lining however, because the rate of increase is slowing and the higher gold price has eased pressure on producer margins. Using the quarterly average spot price of US$1,977/oz, the global average margin in Q4’23 was a relatively healthy US$635/oz, creeping back towards the levels of H1’22, but still some way off the record margins of 2020.
Producer AISC Margins remain fairly robust on the back of the stronger gold price
Quarterly global average AISC, AISC margins and gold price US$/oz*

*Data as of 31 December 2023.
Source: Metals Focus Gold Mines Cost Service
Local inflation within numerous producer countries fell throughout the year. Additionally, oil, natural gas and cyanide prices all trended downwards, which one would expect to have contributed to lower operating costs. Yet any benefit was likely negated by higher employee related costs (a result of the ongoing skills shortage within the industry), continuing elevated prices for some consumables and the strengthening of local currencies against the US dollar. Furthermore, those companies operating in higher risk areas have experienced a rise in their security costs. Consequently, costs continue to fluctuate and regional variations persist.
The average AISC for North America was up 2% q/q to US$1,522/oz in Q4’23. This was the highest of all the regions and continued the upward trend in costs that began in 2017. The average AISC margin for the region was US$454/oz, a rise of 4% q/q but still significantly lower than margins in 2021. Barrick reported a higher q/q AISC at Nevada Gold Mines, underpinned by increased Total Cash Costs (TCC) and sustaining capital expenditure. Newmont recorded increased AISC at Peñasquito as the mine processed lower tonnage and grade during its ramp up following the strike action of Q2 and Q3.
In Oceania the AISC rose by 1% q/q to US$1,132/oz. This led to an average AISC margin of US$692/oz, an increase of 7% q/q. Newmont reported higher q/q AISC at Boddington and Tanami. At Boddington lower grade ore was milled during the quarter and at Tanami the company reported higher direct mining costs. Conversely, Evolution Mining recorded lower AISC at its Cowal operation due to higher grade ore being processed and higher recoveries. Northern Star Resources had a mixed quarter. The KCGM mine had lower AISC as it benefited from the first higher grade ore from Golden Pike North but the Yandal operations were affected by reduced mill availability leading to an increase in AISC.
South America’s average AISC continued to fall in Q4’23, down 3% q/q to US$1,372/oz leading to an average AISC margin for the quarter of US$604/oz. The drop in AISC was underpinned by higher grades processed and an average TCC of US$998/oz. This was the first time the TCC for the region had fallen below US$1,000/oz since Q4’22. At Newmont’s Yanacocha mine in Peru the AISC benefited from higher by-product credits and inventory change. Conversely, AngloGold Ashanti reported a higher AISC at Cerro Vanguardia in Argentina as mine costs were significantly impacted by rampant inflation, which the company reported to be 211.4% by year end, and the weakening of the Argentinian peso.
Costs – and subsequently margins – are expected to remain under pressure in the near term. The Brent Crude oil price increased by 13% between January and mid-April and although it has fallen back a little, it is still trading over US$80/barrel. In some regions the cost of consumables remains high and all regions are subject to rising employee costs as a result of the industry-wide skills shortage.
Disclaimer
Copyright and other rights
© 2024 World Gold Council. All rights reserved. World Gold Council and the Circle device are trademarks of the World Gold Council or its affiliates.
Any references to LBMA Gold Price are used with the permission of ICE Benchmark Administration Limited and have been provided for informational purposes only. ICE Benchmark Administration Limited accepts no liability or responsibility for the accuracy of the prices or the underlying product to which the prices may be referenced. All third-party content is the intellectual property of the respective third party and all rights are reserved to such party.
Reproduction or redistribution of any of this information is expressly prohibited without the prior written consent of World Gold Council or the appropriate intellectual property owners, except as specifically provided below.
Use of any statistics in this information is permitted for the purposes of review and commentary in line with fair industry practice, subject to the following pre-conditions: (i) only limited extracts may be used; and (ii) any use must be accompanied by a citation to World Gold Council and, where appropriate, to Metals Focus, Refinitiv GFMS, or other identified third party, as their source.
World Gold Council does not guarantee the accuracy or completeness of any information and does not accept responsibility for any losses or damages arising directly or indirectly from the use of this information.
This information is not a recommendation or an offer for the purchase or sale of gold or any products, services, or securities.
This information contains forward-looking statements which are based on current expectations and are subject to change. Forward-looking statements involve a number of risks and uncertainties. There is no assurance that any forward-looking statements will be achieved.
Information regarding QaurumSM and the Gold Valuation Framework
Note that the resulting performance of various investment outcomes that can generated through use of Qaurum, the Gold Valuation Framework and other information are hypothetical in nature, may not reflect actual investment results and are not guarantees of future results. Neither WGC nor Oxford Economics provides any warranty or guarantee regarding the functionality of the tool, including without limitation any projections, estimates or calculations.
