Gold Cost Drivers: A Veritable Pick and Mix
28 October, 2024
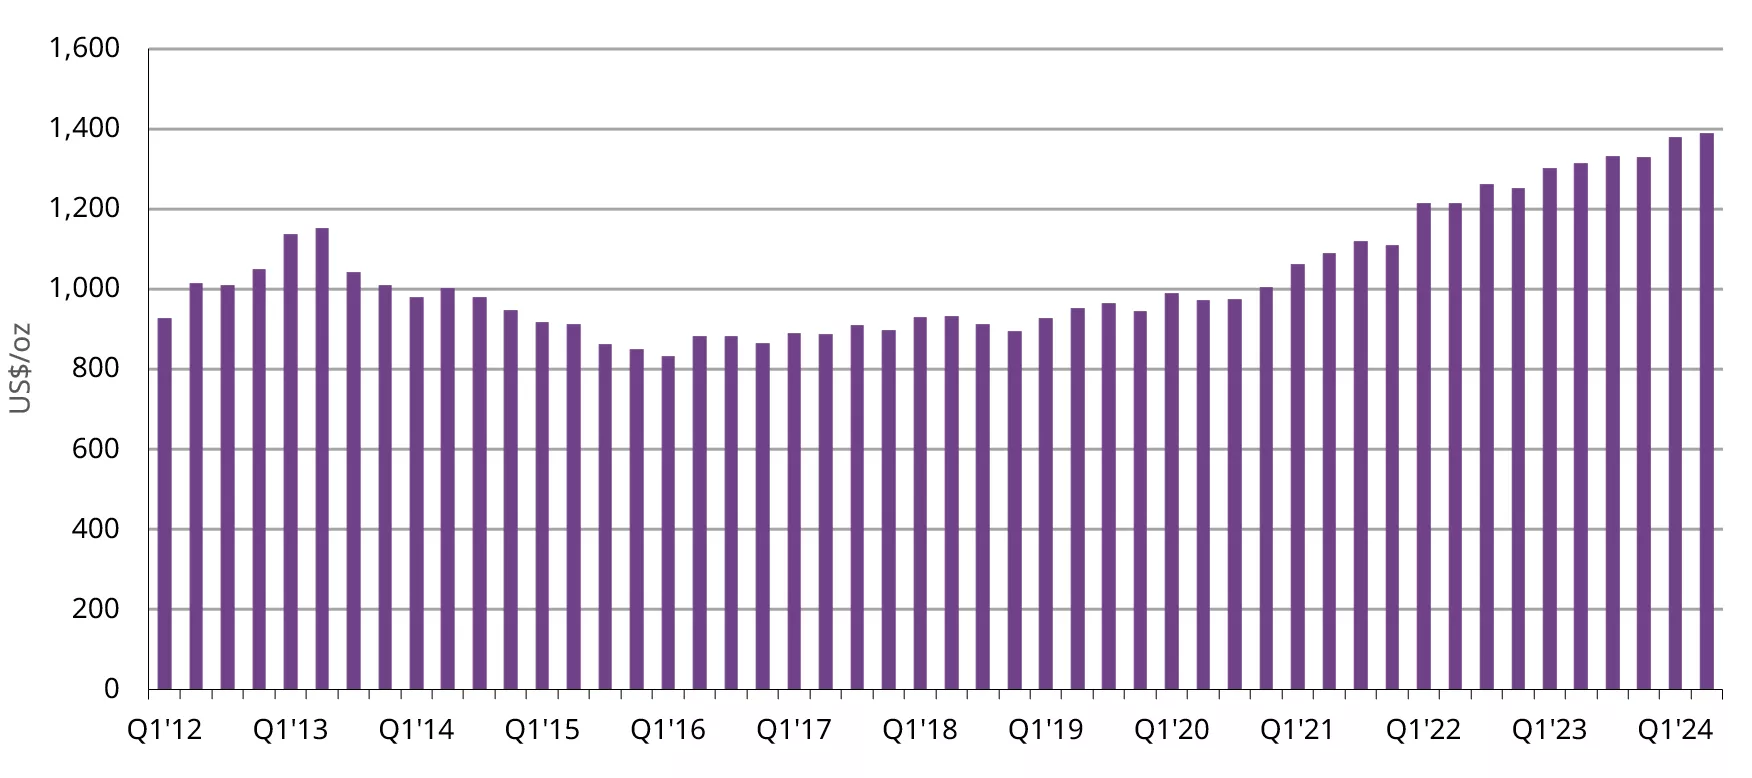
In Q2’24, dare it be written, All-In Sustaining Costs (AISC) rose again, creeping up by 1% q/q, or a more substantial 6% y/y to US$1,388/oz. In some ways, the onward march of AISC in the last couple of years is reminiscent of hill-walking; just when you think you’ve reached the top, there’s always that little bit more hill to climb. And yet, in Q2’24, it isn’t just the usual suspects driving this growth.
Gold production costs continued to climb in Q2’24
Monthly gold AISC, US$/oz*

*Data to 30 June 2024.
Source: Metals Focus Gold Mine Cost Service
On average, cash operating costs were down 2% q/q to US$938/oz, but compared to Q2’23 were up 5% y/y. Inflation in key producing countries such as Australia, Canada and the United States fell q/q, driven by lower fuel prices. The quarterly average Brent Crude price of US$77.3/barrel was 3% lower q/q and down 6% y/y. While this would have brought some relief to producers it is still considerably higher than oil prices of a few years ago, with a real risk that it may rise further before the end of the year.
One key element of cash operating costs, labour, remains elevated. In Australia, the Australian Bureau of Statistics reported that the mining industry had the highest quarterly rise in wages out of all the industry sectors it monitors during Q2’24, up 1.3% q/q, or 4% y/y. This issue isn’t just limited to Australia however. Newmont recorded higher labour costs at both Cero Negro in Argentina and Ahafo in Ghana. AngloGold Ashanti reported increased labour costs at Iduapriem, also in Ghana, while Harmony disclosed a 9% y/y rise for H1’24 for its operations in South Africa and Papua New Guinea.
In terms of production, the higher gold price has enabled some companies to process lower grade ore and stockpiles. Agnico Eagle processed lower grade material at Goldex and Macassa in Canada and Fosterville in Australia. Northern Star processed more stockpiled material at KCGM, lowering the head grade and AngloGold Ashanti mined lower grade ore at Sunrise Dam in Australia. Furthermore, some operations were affected by further weather events, for example Evolution Mining’s Mungari in Australia, and others by unforeseen incidents such as the fire in Northern Star’s Jundee processing plant. All these factors led to a drop in gold production and a rise in on-site production costs.
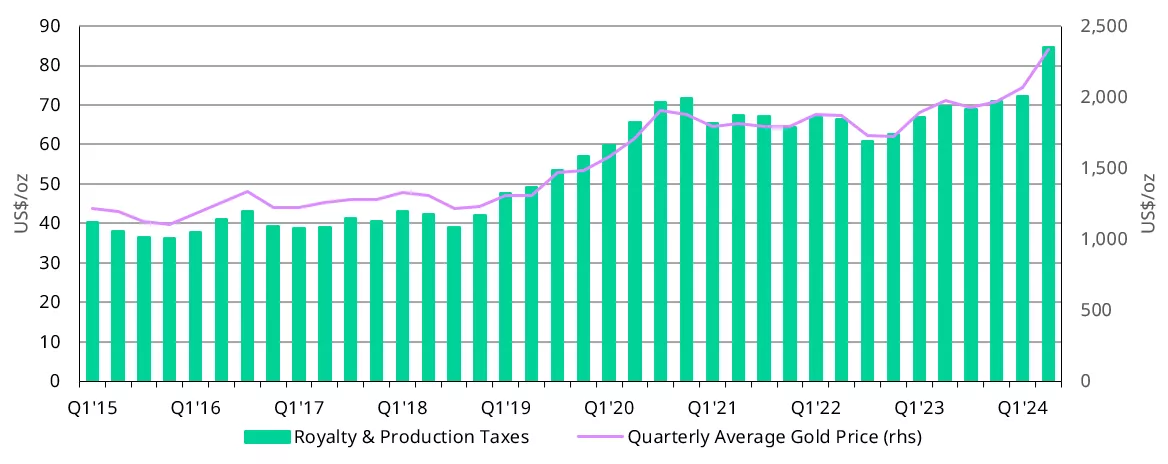
Not surprisingly, there has been a sizeable increase in average royalties and production taxes as the gold price has risen. Average royalties were US$85/oz in Q2’24, up 17% q/q or 22% y/y, continuing the upward trend which began in 2019. Barrick reported higher royalties at Carlin, part of the Nevada Gold Mines complex, and Loulo-Gounkoto in Mali, among others. Newmont reported higher third party royalties at Ahafo in Ghana and Agnico Eagle cited increased royalties as one of the drivers behind its higher costs for the quarter. Endeavour Mining also reported higher royalties, particularly in Burkina Faso where the royalty rate was increased in Q4’23. Despite this rise, our data shows that average royalties and production taxes accounted for 6% of the AISC in Q2’24, only one percentage point higher than in Q2’23.
Rising producer royalties on the back of the higher gold price
Producer Royalty and Production Taxes and Gold Price US$/oz*

*Data to 30 June 2024.
Source: Bloomberg, Metals Focus
Sustaining capital expenditure also rose during the quarter, to an estimated US$301/oz, up 5%, both q/q and y/y. The increased spending was for varying reasons. Barrick incurred higher sustaining capital costs at Kibali, in the DRC, due to an increase in capitalised waste stripping and at Carlin in Nevada and Loulo-Gounkoto in Mali because of equipment purchases. Gold Fields reported increased sustaining capital expenditures at St Ives in Australia due to the development of two new open pits. The company also reported a rise at South Deep in South Africa, in part due to the level 9 rollout of a Collision Avoidance system. Elsewhere in Senegal, Endeavour disclosed an increase in this expenditure at Sabodala-Massawa in Senegal due to equipment rebuilds and geotechnical work.
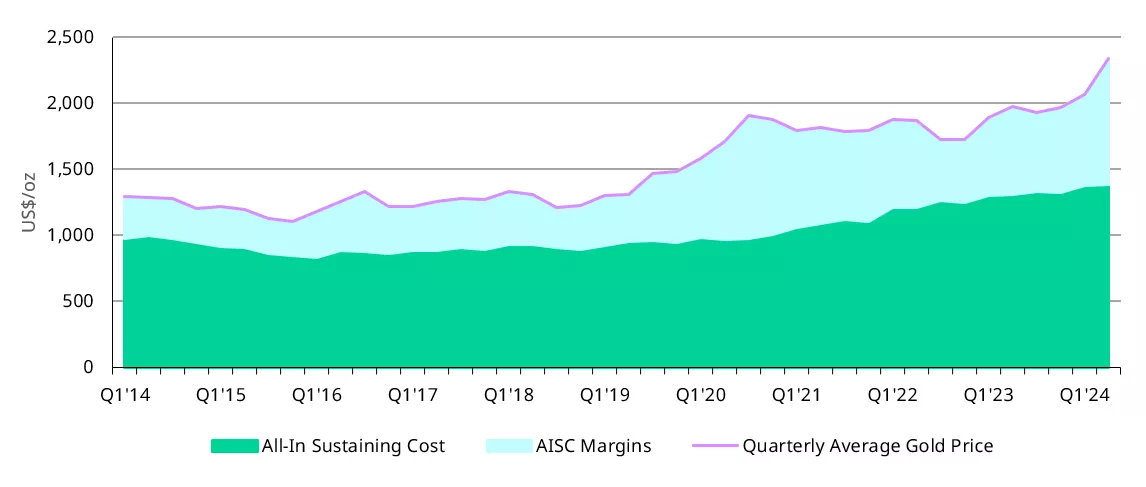
On the upside, the jump in the quarterly average gold price in Q2’24 gave a welcome boost to average producer AISC margins, propelling them to US$950/oz. This surpassed the significant margins of the COVID-19 pandemic in 2020 and is the highest margin since Q1’12. These margins more than offset the higher costs and ensured that 97% of gold producers were profitable during the quarter.
Average producer margins reach record highs
AISC, AISC Margins and Quarterly Average Gold Price US$/oz*

*Data to 30 June 2024.
Source: Bloomberg, Metals Focus
To borrow a phrase from footballing parlance, Q2’24 really was a game of two halves: on the one hand, AISC costs continued to rise but on the other, AISC margins climbed, providing a welcome buffer. As discussed, the underlying causes of cost escalation in Q2’24 were diverse and it will be interesting to see if this scenario continues into Q3’24. Will costs finally start to come down, or will they, as in the words of the singer Kate Bush, keep ‘running up that hill?’
