You asked, we answered: Gold hits $3,000 – What comes next?
17 March, 2025
Key highlights
- Gold’s new milestone: Gold recently crossed US$3,000/oz intraday – a headline-worthy event, but the true significance for gold lies in the broader economic trends driving its rise
- Price momentum: Gold surged from US$2,500/oz to US$3,000 in just 210 days, pushing it three standard deviations above its 200-day moving average
- Market fundamentals: While gold may face some consolidation due to the speed of its latest move, the combination of geopolitical and geoeconomic uncertainty, rising inflation, lower rates and a weaker US dollar continue to provide powerful tailwinds to investment demand.
Gold (briefly) breaks through another psychological level
Gold crossed US$3,000/oz in intra-day trading during the early hours of Friday 14 March and then again on Monday 17 March.1 While the LBMA Gold Price PM hasn’t officially crossed the mark, setting at US$2,996.50/oz on Monday, it has nonetheless grabbed the attention of investors and media outlets around the world, triggering a myriad of questions about its significance.
So, what does this milestone really mean? Depending on who you ask: a lot or not much at all. For us, there are interesting psychological and technical aspects about this triple-zero ending price that could influence gold’s short-term behaviour. But the more meaningful – and lasting – dynamics are the ones behind gold’s performance over the past several months.
What’s meaningful about gold’s move?
Gold reached more than 40 new all-time highs in 2024 and fourteen more so far this year.2 Its upward move has been no coincidence and, in our most recent Gold Market Commentary, we talked about a potential perfect storm forming for gold. The focus isn’t just the number itself but the pace at which gold has reached it. The jump from US$2,500/oz to US$3,000/oz took just 210 days – a notably faster move that underscores the momentum gold has built over the past two years (Chart 1). Compare that to the approximate 1,700 days that gold took, on average, to achieve previous US$500/oz increments, and the move stands out (Table 1).
Chart 1: Gold’s recent surge defied historical trends, reaching $3,000 in record time
Historical price data shows gold has averaged 1,708 days to climb $500 increments, yet the latest jump took just 210 days*
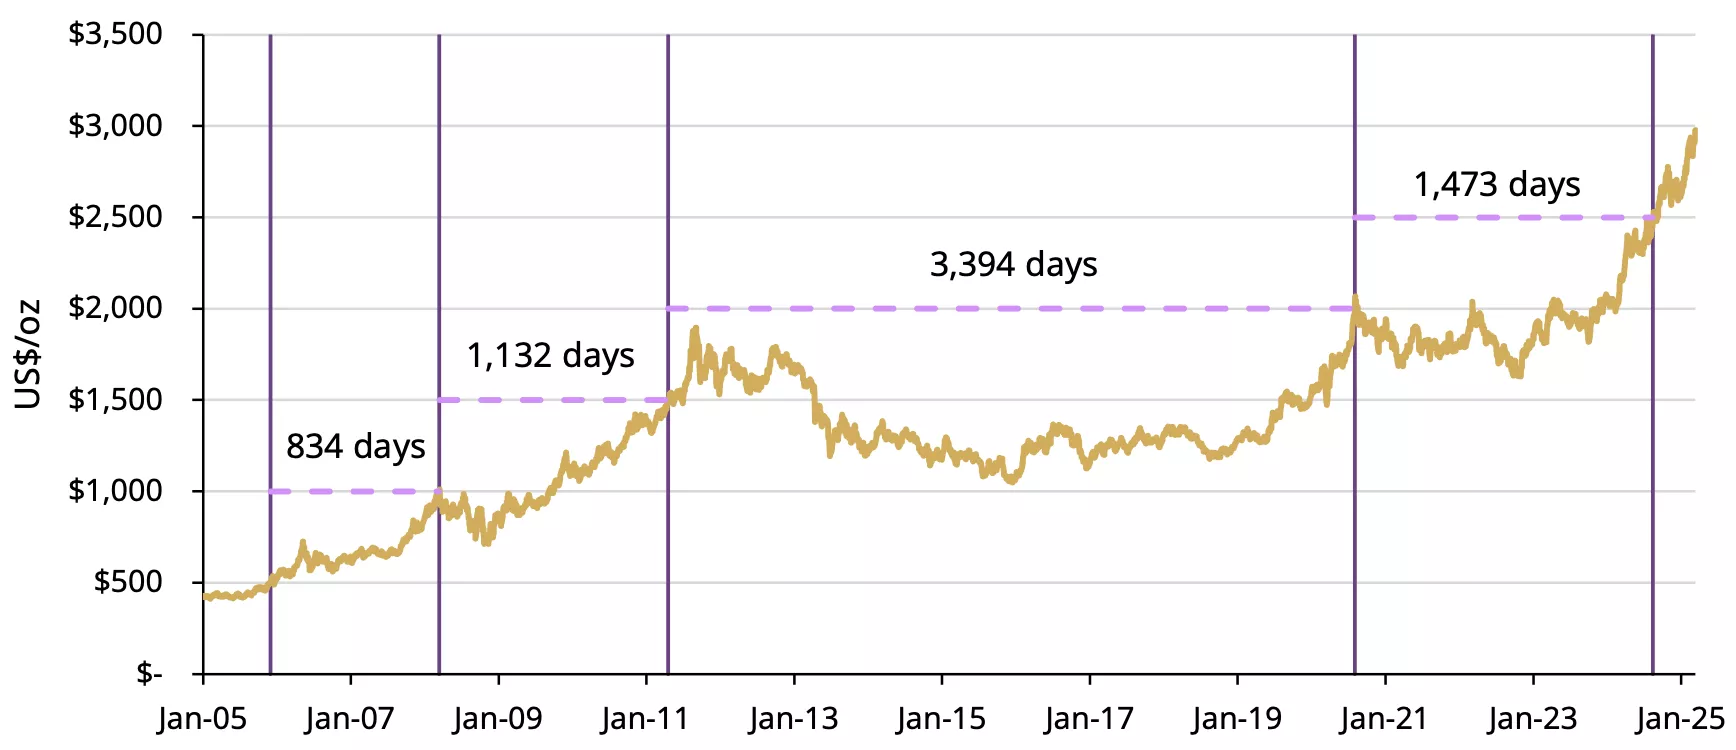
*Each vertical lines signifies the date when each initial $500 incremental level was breached starting with $500 (far left side) and the last line (furthest to the right) representing $2,500
Source: Bloomberg, World Gold Council
Table 1: Historical gold price support & resistance level overview
Historical gold price support and resistance level summary*
| Price Level ($/oz) | Breakout date | Days above | Initial pullback date | Recovery date | Round trip days | Days to next milestone | Years to next milestone |
| 500 | 12/01/2005 | 18 | 12/20/2005 | 12/22/2005 | 2 | 834 | 2 |
| 1,000 | 3/14/2008 | 3 | 3/18/2008 | 09/11/2009 | 542 | 1132 | 3 |
| 1,500 | 4/20/2011 | 14 | 05/05/2011 | 05/09/2011 | 4 | 3394 | 9 |
| 2,000 | 08/04/2020 | 6 | 08/11/2020 | 8/18/2020 | 7 | 1473 | 4 |
| 2,500 | 8/16/2024 | 5 | 8/22/2024 | 8/23/2024 | 1 | TBD | TBD |
| Average | 9 | 111 | 1708 | 4.7 | |||
| Median | 6 | 4 | 1303 | 3.6 |
*Based on the LBMA Gold Price PM as of 17 March 2025. Breakout date defined as first day gold broke through resistance. Pullback date defined as first date that gold fell through support level (resistance level it just broke). Recovery date is the date on which gold round tripped back through its prior support/resistance level and stayed above that.
Source: Bloomberg, World Gold Council
In fairness, gold had to double in price to go from US$500/oz to US$1,000/oz, while it only had to rise 20% to go from US$2,500/oz to US$3,000/oz. To provide additional context, gold has increased nearly sixfold since December 2005, when it first reached US$500/oz, equivalent to an annualised return of 9.7%. Over the same period, the S&P 500 spot index has increased at a rate of 8.2% per year.3
To take this relative movement into account, we look instead at how much gold has deviated from its 200-day moving average (200DMA). The recent rally has pushed gold’s price three standard deviations (3σ) above the long-term average spread of its 200DMA (Chart 2). Most recently, we saw this extreme divergence during the COVID-19 pandemic in 2020 when gold crossed US$2,000/oz and again around the time gold reached US$2,500/oz. Following these moves there was a period of consolidation before the upward trend eventually resumed.
Chart 2: Gold’s recent move to US$3,000/oz represents a 3σ divergence above its moving average
Difference (spread) between spot gold (XAU) and its 200DMA*
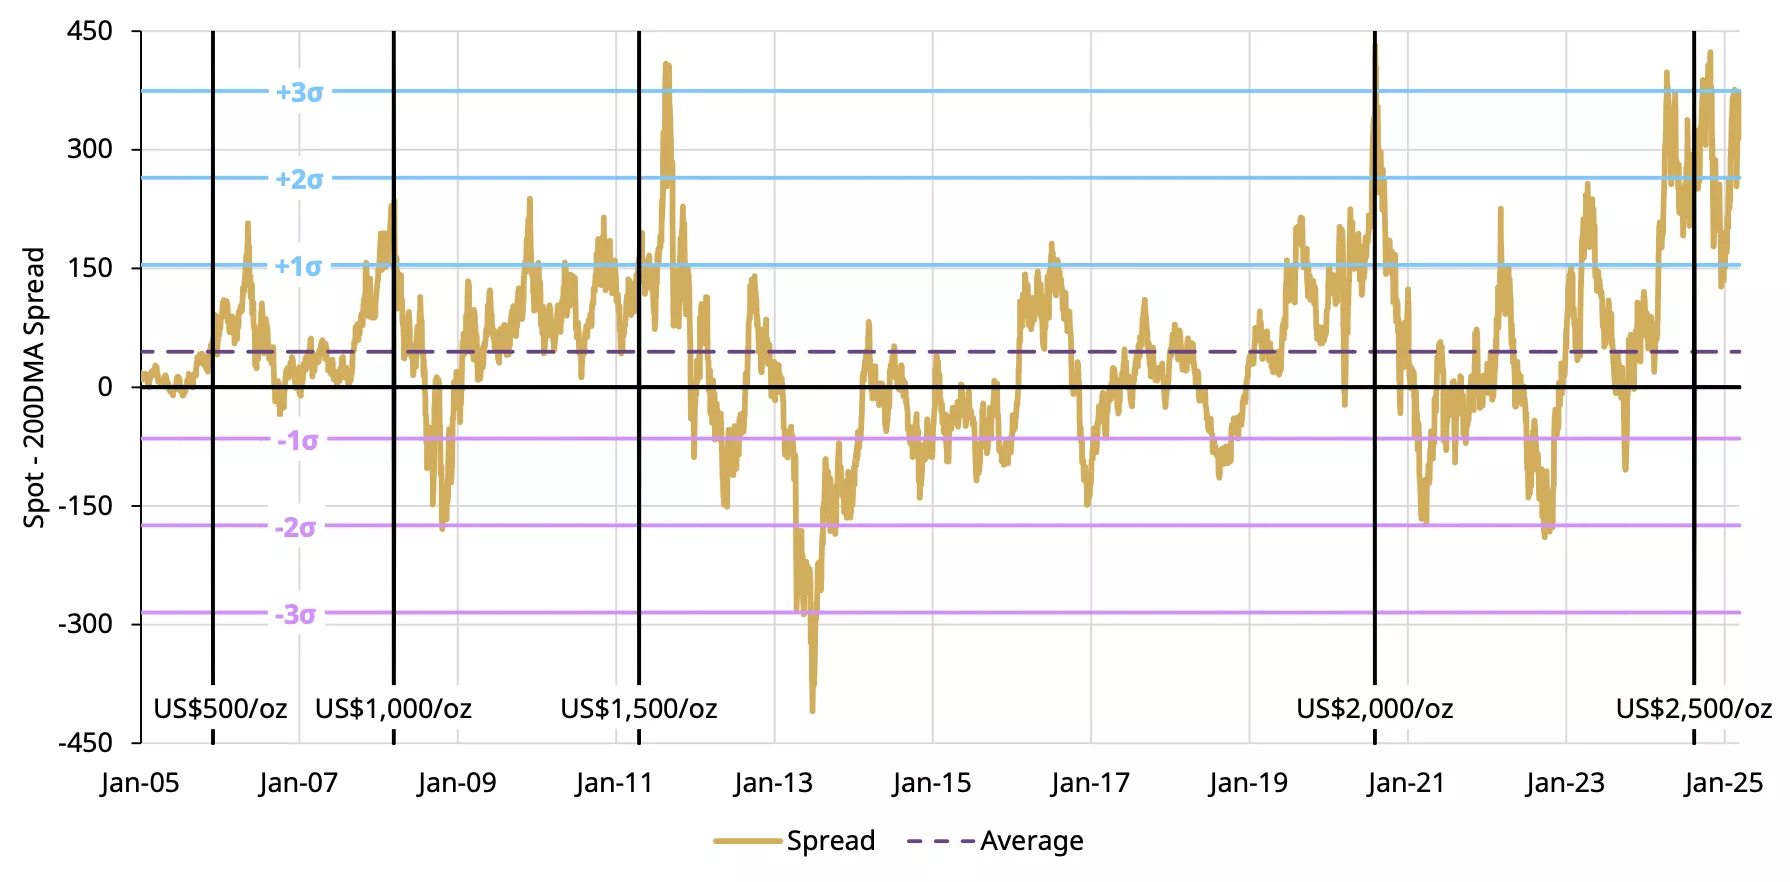
*Based on spot gold (XAU) as of 14 March 2025. Spread calculated as daily difference between spot price and its 200DMA. Each vertical black lines signifies the date when each initial US$500/oz incremental level was breached starting with US$500/oz (far left side) and the last black line (furthest to the right) representing US$2,500/oz.
Source: Bloomberg, World Gold Council
What’s next?
As the saying goes, “even strong rallies need to catch their breath.” Gold has remained, on average, above previous multiples of US$500/oz for nine days before pulling back (Table 1). At the same time, however, gold has rebounded above the same level in just a few days four out of five times.
From a technical and positioning standpoint, if gold were to remain above US$3,000/oz over the next couple of weeks, it would likely trigger additional buying from derivatives contracts. For example, we estimate there is roughly US$8bn in net delta-adjusted notional in options contracts from US gold ETFs that expire Friday 21 March,4 and US$16bn in options on futures that expire on 26 March. While this may create a slingshot effect, it could also trigger short-term-profit taking.
In view of the speed of gold’s latest move, it would not be surprising to see some price consolidation. But despite potential short-term volatility, the most important determinant for gold’s next move is whether fundamentals can provide long-term support to its trend. As we discussed in our recent Gold Demand Trends, while price strength will likely create headwinds for gold jewellery demand, push recycling up and motivate some profit taking, there are many reasons to believe that investment demand will continue to be supported by a combination of geopolitical and geoeconomic uncertainty, rising inflation, lower rates and a weaker US dollar.
Footnotes
1Indicative Bloomberg data on spot gold (XAU) suggests that gold broke through US$3,000/oz in the morning of Friday 14 March and Monday 17 March 2025.
2Based on the LBMA Gold Price PM, as of 17 March 2025.
3Including and reinvesting dividends, the S&P 500 has increased by approximately 10% between 1 December 2005 and 14 March 2025.
4The delta adjusted notional outstanding is based on options on the largest two US gold ETFs, GLD and IAU, which we estimate at $8bn and $20mm, respectively as of 17 March.
Disclaimer
Important information and disclaimers
© 2025 World Gold Council. All rights reserved. World Gold Council and the Circle device are trademarks of the World Gold Council or its affiliates.
All references to LBMA Gold Price are used with the permission of ICE Benchmark Administration Limited and have been provided for informational purposes only. ICE Benchmark Administration Limited accepts no liability or responsibility for the accuracy of the prices or the underlying product to which the prices may be referenced. Other content is the intellectual property of the respective third party and all rights are reserved to them.
Reproduction or redistribution of any of this information is expressly prohibited without the prior written consent of World Gold Council or the appropriate copyright owners, except as specifically provided below. Information and statistics are copyright © and/or other intellectual property of the World Gold Council or its affiliates or third-party providers identified herein. All rights of the respective owners are reserved.
The use of the statistics in this information is permitted for the purposes of review and commentary (including media commentary) in line with fair industry practice, subject to the following two pre-conditions: (i) only limited extracts of data or analysis be used; and (ii) any and all use of these statistics is accompanied by a citation to World Gold Council and, where appropriate, to Metals Focus or other identified copyright owners as their source. World Gold Council is affiliated with Metals Focus.
The World Gold Council and its affiliates do not guarantee the accuracy or completeness of any information nor accept responsibility for any losses or damages arising directly or indirectly from the use of this information.
This information is for educational purposes only and by receiving this information, you agree with its intended purpose. Nothing contained herein is intended to constitute a recommendation, investment advice, or offer for the purchase or sale of gold, any gold-related products or services or any other products, services, securities or financial instruments (collectively, “Services”). This information does not take into account any investment objectives, financial situation or particular needs of any particular person.
Diversification does not guarantee any investment returns and does not eliminate the risk of loss. Past performance is not necessarily indicative of future results. The resulting performance of any investment outcomes that can be generated through allocation to gold are hypothetical in nature, may not reflect actual investment results and are not guarantees of future results. The World Gold Council and its affiliates do not guarantee or warranty any calculations and models used in any hypothetical portfolios or any outcomes resulting from any such use. Investors should discuss their individual circumstances with their appropriate investment professionals before making any decision regarding any Services or investments.
This information may contain forward-looking statements, such as statements which use the words “believes”, “expects”, “may”, or “suggests”, or similar terminology, which are based on current expectations and are subject to change. Forward-looking statements involve a number of risks and uncertainties. There can be no assurance that any forward-looking statements will be achieved. World Gold Council and its affiliates assume no responsibility for updating any forward-looking statements.
Information regarding QaurumSM and the Gold Valuation Framework
Note that the resulting performance of various investment outcomes that can be generated through use of Qaurum, the Gold Valuation Framework and other information are hypothetical in nature, may not reflect actual investment results and are not guarantees of future results. Neither World Gold Council (including its affiliates) nor Oxford Economics provides any warranty or guarantee regarding the functionality of the tool, including without limitation any projections, estimates or calculations.
