Fuelled by the COVID-19 pandemic, Australia’s already declining cash target rate dropped to 0.1% in 2020, the lowest since 1990. This led to a reduction in Australian superannuation fund allocations to cash and bonds and an increase in risk-on assets, such as equities, in the hunt for returns (Chart 1). But will this move help achieve their desired returns at reasonable risk levels? 

We analysed a hypothetical super fund average portfolio based on historical data over the past 20 years. Results show that as the weight of equities rose, the portfolio return saw only mild improvement whilst its volatility increased markedly, resulting in a lower risk-adjusted return. We also constructed a similar portfolio with a gold allocation: gold’s presence not only enhanced portfolio returns, but also lowered volatility. 

Our analysis shows that gold’s diversification benefits, together with its ability to offer downside protection, generate returns and protect against inflation, could make gold a valuable strategic component in Australian super funds


Chart 1: Less cash and fixed-income assets, more equities in Australian super fund portfolios

Less cash and fixed-income assets, more equities in Australian super fund portfolios

Asset allocation changes between the 5-year average (2016-2020) and Q2 2021*

Less cash and fixed-income assets, more equities in Australian super fund portfolios
Asset allocation changes between the 5-year average (2016-2020) and Q2 2021*
*As of June 2021, based on average fund allocation in each sector provided by the Australia Prudential Regulatory Authority.

Sources: Australian Prudential Regulation Authority, World Gold Council; Disclaimer

*As of June 2021, based on average fund allocation in each sector provided by the Australia Prudential Regulatory Authority.


The low yield environment is driving Australian super funds to riskier assets

Australia’s interest rate has dropped to a record low 

The declining trend in Australia’s policy rate originated in 2011. With Australia’s economic growth slowing and headline inflation declining, the Reserve Bank of Australia (RBA) made 15 rate cuts between 2011 and 2019.1 In 2020, to steer its economy through the pandemic, the RBA made three further cuts in March and November, slashing its policy rate to 0.1%, a record low2 (Chart 2).


Chart 2: As the policy rate declined the Australian government bond yields also lowered

As the policy rate declined the Australian government bond yields also lowered

The RBA target cash rate and 10-year Australian treasury yield*

As the policy rate declined the Australian government bond yields also lowered
The RBA target cash rate and 10-year Australian treasury yield*
*Weekly data as of September 2021.

Sources: Bloomberg, Reserve Bank of Australia, World Gold Council; Disclaimer

*Weekly data as of September 2021.


And the low-rate environment in Australia could last. In its recent statement the RBA reiterated that its accommodative monetary policy, including keeping the interest rate at the lowest level in history and continuing its bond purchase programs, could remain in place until at least 2024. 

Super funds are adding more risk to their portfolios as the low-yield environment creates return challenges 

The declining interest rate has contributed to the downward trend in Australian super fund returns over the past years. Between 2016 and 2020 cash and fixed-income assets, both domestic and international, accounted for 32% of an average super fund portfolio. Inevitably, returns were negatively impacted as interest rates around the globe fell. The average super fund annual returns were 11% in 2005, 8% in 2010, 7% in 2015, 6% in 2019 and -0.2% in 2020 (Chart 3).3 


Chart 3: Australian super fund returns have been falling 

Australian super fund returns have been falling

The average super fund annual rate of returns*

Australian super fund returns have been falling
The average super fund annual rate of returns*
*The average returns of super funds refer to the annual average actual returns of over 150 Australian super funds tracked by the APRA.

Sources: Australian Prudential Regulation Authority, World Gold Council; Disclaimer

*The average returns of super funds refer to the annual average actual returns of over 150 Australian super funds tracked by the APRA


In the hunt for returns, super funds are adding more equities to their portfolios (Chart 1). The weight of equities – both domestic and international – in an average super fund portfolio increased to 55% in Q2 2021, from 49% a year ago. By contrast, compared to one year ago, these funds’ allocations to cash and fixed-income assets declined by 2% and 3% respectively.

The attractiveness of cash and bonds waned as super fund managers strove to achieve necessary returns in an environment of falling interest rates. And according to our institutional investor survey results the need for returns has also become a key influencer in global institutional investors’ asset allocation decisions (Focus 1).

Focus 1: Institutional investors around the globe are changing their asset allocation strategies


Meeting required returns has become a universal challenge for institutional investors in this prolonged low-yield environment. We recently published Rethink, Rebalance, Reset, in which we detail the results of a joint study that questioned nearly 500 institutional investors across the globe; the study was conducted by Coalition Greenwich and the World Gold Council. The report shows that the need to meet return objectives is the most vital driver of these institutional investors’ short- and long-term asset allocation decisions. 

The future asset allocation plans of global institutional investors are somewhat similar to those of Australian super fund managers. Amid the low-rate environment, institutional investors choose to reduce their allocation of cash and fixed-income assets in the next three years. Meanwhile, they expect a 1% and 2% increase in alternatives and “other” assets – which include infrastructure and real estate – respectively, to enhance returns (Chart 4). 

Moreover, our survey results show that while 40% of current gold investors plan to increase their allocation to gold in the next three years, 40% of non-gold holding institutions have plans to enter the gold market. When asked about the drivers of gold allocation, portfolio diversification benefits and long-term risk-adjusted return enhancement were repeatedly quoted in our survey by both existing and potential gold investors.


Chart 4: Global institutional investors are adding more “alternative” and “other” assets to their portfolios*

Global institutional investors are adding more “alternative” and “other” assets to their portfolios*

Global institutional investors are adding more “alternative” and “other” assets to their portfolios*
*Other is approximately 40-50% real assets, including real estate and infrastructure. **Based on 442 respondents. ***Based on 382 respondents. Source: Coalition Greenwich, World Gold Council

Sources: Coalition Greenwich, World Gold Council; Disclaimer

*Other is approximately 40-50% real assets, including real estate and infrastructure.
**Based on 442 respondents. ***Based on 382 respondents.


Is adding more equities the best way to improve super fund performance? 

To explore this question, we constructed three simplified hypothetical portfolios that consist only of stocks and bonds – all contain domestic and international assets based on the average Australian super fund portfolio in Q2 2021. These portfolios are:

  • Aggressive

30% fixed-income assets + 70% equities 

  • Growth

40% fixed-income assets + 60% equities

  • Base case

50% fixed-income assets + 50% equities.

Analysing historical data over the past 20 years we found that although a higher allocation to equities lifts the portfolio’s return mildly, it also leads to a notable increase in volatility. Consequently, the portfolio’s risk-adjusted return falls as its allocation to equities rises. In the meantime, the portfolio’s downside risk – measured by its maximum drawdown – also increases. This simplified illustration shows that reducing bonds and adding more equities fails to improve the base-case portfolio.

Table 1: More equities bring no significant change in returns

Risk-return profile of different portfolios*


 AggressiveGrowthBase case
Annualised return4.26%4.26%4.26%
Annualised volatility7.39%6.23%5.23%
Risk-adjusted return0.5760.6830.814
Maximum drawdown29.28%23.02%16.35%

*Based on monthly data between September 2001 and September 2021. Fixed-income asset index is represented by 57% Bloomberg AusBond 0+ Year Index and 43% Bloomberg Global Aggregate Index; equity index consists of 42% S&P/ASX 300 Index and 58% MSCI World ex-Australia Index. These weightings are based on the APRA's most recent publication of super funds’ fixed-income and equity average allocations

Source: Australian Prudential Regulatory Authority, Bloomberg, World Gold Council


A question naturally follows: how can we therefore improve the portfolio’s performance?

To answer this we turned to gold, an asset seldom noticed by Australian super funds but which has a proven track record of improving portfolio performance across various types of portfolios.

This hypothetical portfolio, named “gold balanced”, includes: 

40% fixed-income assets + 50% equities + 10% gold (in Australian dollars).4 

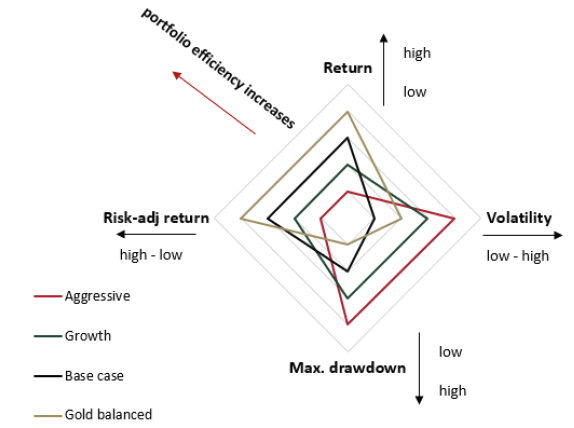
With an annualised return of 4.8%, volatility of 5.4%, risk-adjusted return of 0.89 and maximum drawdown of -13%, the gold balanced portfolio outperformed the other portfolios under consideration during the same period (Chart 5). 

Chart 5: The gold balanced portfolio has the highest return and lowest risk of the four sample portfolios mentioned above

Ranking of each portfolio’s performance attributes*

*Based on the performance attributes of the four portfolios between September 2001 and September 2021. Returns, volatilities and risk-adjusted returns are ranked in an ascending order, negative numbers of maximum drawdowns are ranked in a descending order. 

Source: Bloomberg, World Gold Council


Why is gold a valuable addition to Australian super funds? 

A look at the super fund average portfolio 

We also compared the performance of a hypothetical super fund average portfolio in Q2 2021, a hypothetical portfolio with an additional 5% equity allocation, and a hypothetical portfolio with 5% gold, looking at each over different time horizons (Table 2). 

Similar to our previous findings, more equity exposure resulted in slightly higher returns but with notably higher risks and lower risk-adjusted returns in all periods. In contrast, a 5% allocation to gold significantly improved the hypothetical portfolio’s risk-adjusted return and reduced its maximum drawdown. And the difference became more obvious as rotation out of bond increased (Chart 6). 


Chart 6: Adding gold leads to higher risk-adjusted returns, adding more equities doesn't

Adding gold leads to higher risk-adjusted returns, adding more equities doesn't

A hypothetical super fund average portfolio's risk-adjusted return under various combinations of equity and gold exposure over the past 20 years*

Adding gold leads to higher risk-adjusted returns, adding more equities doesn't
A hypothetical super fund average portfolio's risk-adjusted return under various combinations of equity and gold exposure over the past 20 years*
*Based on monthly data between September 2001 and September 2021.

Sources: Australian Prudential Regulation Authority, Bloomberg, ICE Benchmark Administration, World Gold Council; Disclaimer

*Based on monthly data between September 2001 and September 2021.


We believe that gold’s ability to improve performance of the average super fund portfolio – based on historical analysis – may be underpinned by the following factors: 

1.    Gold brings diversification benefits and downside protection

Our analysis shows that gold has a negative or very low correlation with most assets usually held by Australian super funds (Chart 7). And gold also has a negative relationship with the Australian dollar – a key feature for many local investors as the majority of their investments are in their own currency.

Such diversification benefits have historically offered downside protection for investors during stressed times. A quintessential recent example was the COVID-led weakness in global equity markets: in Q1 2020, while the S&P/ASX 300 stock index fell by 24%, gold rose by 21%; meanwhile, the Australian dollar depreciated by nearly 13%.

During the Global Financial Crisis between November 2007 and March 2009, gold rallied 67% while the Australian and US equity markets fell by 53% and 48% respectively. And during local equity market plunges over the past two decades the average loss on the ASX 300 stock index reached 23% while gold averaged a return of 21%.

Table 2: Gold could be a better performance enhancer than additional equities for an average super fund

Comparison of an average 2019 super fund portfolio, the average portfolio with 5% allocation to gold and the average portfolio with 5% additional allocation to equities, while proportionately reducing other weightings*


 20-year15-year5-year
 Average5% gold5% more
equities
Average5% gold5% more
equities
Average5% gold5% more
equities
Annualised return4.18%4.38%4.19%3.81%4.06%3.81%6.28%6.36%6.65%
Annualised volatility7.28%6.59%7.70%7.70%6.87%8.11%8.10%7.26%8.46%
Risk-adjusted returns0.57410.66510.54420.49540.59170.46930.77490.87710.7854
Maximum drawdown-31.35%-26.23%-33.06%-31.35%-26.23%-33.06%-14.10%-11.83%-14.78%

*As of September 2021. The average Australian super fund portfolio is based on the average Australian super fund asset allocation in Q2 2021 according to the APRA and benchmarks are selected based on Your Future Your Super (treasury.gov.au). This includes a 54.9% allocation to equities, 18.2% allocation to fixed income, both as described under Table 1, 10.6% allocation to cash products (Bloomberg AusBond Bank Bill Index), 7.7% to Australian property (S&P/ASX 300 A-REIT), 5.6% to unlisted Australian infrastructure (MSCI Australia Infrastructure Net Total Return Index), and 3% to “others” (50% international equities and 50% international fixed income assets based on Your Future Your Super (treasury.gov.au) ). All indices are monthly data in AUD. The allocation to gold (LBMA Gold Price AM in AUD)/additional equities comes from a proportional reduction in all other assets.

Source: Bloomberg, Australian Prudential Regulatory Authority, ICE Benchmark Administration, World Gold Council


Chart 7: Gold in Australian dollars has negative correlations with most assets in the average super fund portfolio

Gold in Australian dollars has negative correlations with most assets in the average super fund portfolio

Gold's correlation with different assets*

Gold in Australian dollars has negative correlations with most assets in the average super fund portfolio
Gold's correlation with different assets*
*Based on weekly returns between September 2001 and September 2021 of the S&P/ASX 300 Index, the MSCI World ex-Australia Net Total Return Index, the S&P/ASX 300 A-REIT Index, the MSCI Australia Infrastructure Net Total Return Index, the Bloomberg Commodity Index and the LBMA Gold Price AM. All measured in Australian dollars. Source: Bloomberg, World Gold Council

Sources: Bloomberg, World Gold Council; Disclaimer

*Based on weekly returns between September 2001 and September 2021 of the S&P/ASX 300 Index, the MSCI World ex-Australia Net Total Return Index, the S&P/ASX 300 A-REIT Index, the MSCI Australia Infrastructure Net Total Return Index, the Bloomberg Commodity Index and the LBMA Gold Price AM. All measured in Australian dollars. 


2.    Gold, the liquidity cushion during uncertain times

The deep liquidity in the gold market and its extraordinary performances during market selloffs mean that gold can provide a potential liquidity source for investors. In Q1 2020 super funds faced liquidity challenges. These problems arose from the plunge in global equity markets, large foreign exchange derivative margin calls and higher withdrawals during the economic hardship.5  As a result, super funds sold equities, bonds and other assets to generate cash.

What if gold were in the picture? First, super fund portfolio returns would have been less impaired. For example, gold rocketed in Q1 2020 while equities plummeted. Second, instead of liquidating equities when they were down sharply, super funds could take profit from gold, which rose markedly, to generate cash.

On average, the global gold market trades at A$238bn/day in 2020 including OTC spot, gold futures and other derivatives, and gold ETFs.6  This vast and deep market means it is able to accommodate trades at low fractional costs. Also, given the negative relationship between gold and the Australian dollar, the inclusion of gold in a super fund portfolio could reduce the need to hedge foreign exchange risks, as well as reduce the probability of related margin calls during extreme market movements.

3.    Gold generates returns and withstands inflation 

The popular perception that gold contributes zero real return in the long run is inaccurate. Gold pays no interest because it is no one’s liability and has no counterparty or credit risk. But zero interest doesn’t mean zero return. Between 1971 and 2020, gold in Australian dollars has delivered an average annual return of 11% while the ASX 30 stock index’s annual return averaged 9%; it also outperformed Australian sovereign bonds, stocks, cash and commodities. 

Rising inflation has been of concern to investors in many regions lately – and Australia is no exception. In Q2 2021, Australia’s Consumer Price Index (CPI) rose 3.8% y-o-y, the highest in almost 14 years. Meanwhile, asset prices in Australia are also shooting up. For instance, housing price indices of major Australian cities reached record highs in Q2 2021. 


Chart 8: The consumer price index and housing price index in Australia have risen to multi-year highs*

The consumer price index and housing price index in Australia have risen to multi-year highs*

The consumer price index and housing price index in Australia have risen to multi-year highs*
*Based on quarterly data of the average housing price index of eight capital cities in Australia and the consumer price index. As of Q2 2021. Source: Bloomberg, World Gold Council

Sources: Bloomberg, World Gold Council; Disclaimer

*Based on quarterly data of the average housing price index of eight capital cities in Australia and the consumer price index. As of Q2 2021.


Gold has long been trusted as an inflation hedge. We found that, between 1971 and 2020, when annual Australian CPI exceeded 3%, gold provided an annual average nominal return of over 20%, outpacing other real assets such as commodities. 

Our research also shows that gold is closely linked to the global money supply in the long term. This means gold is not just a CPI inflation hedge – it also provides long-term capital preservation for investors in a world where money printers never sleep. This is true for gold held by Australian investors too: between 1971 and 2020, gold averaged an annual return of 11% in local currency, in line with the growth in Australian money supply and higher than the annual average change of 9% in global M2 (Chart 9).


Chart 9: Gold, in AUD, has closely tracked Australian and global money supply

Gold, in AUD, has closely tracked Australian and global money supply

Gold and money supply*

Gold, in AUD, has closely tracked Australian and global money supply
Gold and money supply*
*Based on the annual average of LBMA Gold Price AM in AUD, annual totals of Australian M3 money supply and global M2, which is first calculated by aggregating the available universe of individual country M2 in US dollars (excluding Venezuela due to data quality) as provided by Oxford Economics. Money supplies are re-based to 100 in 1971. All data as of 2020. Source: Bloomberg, ICE Benchmark Administration, Oxford Economics, World Gold Council

Sources: Bloomberg, ICE Benchmark Administration, Oxford Economics, World Gold Council; Disclaimer

*Based on the annual average of LBMA Gold Price AM in AUD, annual totals of Australian M3 money supply and global M2, which is first calculated by aggregating the available universe of individual country M2 in US dollars (excluding Venezuela due to data quality) as provided by Oxford Economics. Money supplies are re-based to 100 in 1971. All data as of 2020.


Conclusion 

The composition of Australian super fund portfolios has been changing. With higher allocations to equities, super funds are hunting for higher returns in a persistent low-yield environment. But our analysis shows that adding more equities might not be the best way for super funds to improve their performance, especially given the already high concentration. We have shown that gold’s presence in the portfolio materially lifts its return and lowers risk, based on historical data analysis. 

We believe that several factors highlight gold to be a more effective strategic component in a hypothetical Australian super fund average portfolio than additional equities; these include: 

  • low or negative correlations with most assets in Australian super funds
  • the ability to provide return and a liquidity cushion during stressed times
  • its strategic role as an inflation hedge and a long-term return enhancer.

As Australian super fund allocations to equities rise to their highest level since 2013 – the earliest data available according to the APRA – some gold might be helpful to fund managers who are hunting for better portfolio performance. 

Footnotes

1For more information, please visit: Monetary Policy | RBA.

2For more information, please visit: Monetary Policy | RBA.

3For more information, please visit: Annual fund-level superannuation statistics | APRA.

4Unless otherwise noted, all gold prices and other asset prices are measured in Australian dollars in this report.

5For more information please visit: Box C: What Did 2020 Reveal About Liquidity Challenges Facing Superannuation Funds? | Financial Stability Review – April 2021 | RBA.

6We only monitor those investing at least 90% through physical gold and appropriately adjust their reported assets to estimate physical holdings only. Similarly, the data only estimates the corresponding gold holdings of ETFs that include other precious metals.

Important disclaimers and disclosures

© 2021 World Gold Council. All rights reserved. World Gold Council and the Circle device are trademarks of the World Gold Council or its affiliates.

All references to LBMA Gold Price are used with the permission of ICE Benchmark Administration Limited and have been provided for informational purposes only. ICE Benchmark Administration Limited accepts no liability or responsibility for the accuracy of the prices or the underlying product to which the prices may be referenced. Other content is the intellectual property of the respective third party and all rights are reserved to them. 

Reproduction or redistribution of any of this information is expressly prohibited without the prior written consent of World Gold Council or the appropriate copyright owners, except as specifically provided below.

The use of the statistics in this information is permitted for the purposes of review and commentary (including media commentary) in line with fair industry practice, subject to the following two pre-conditions: (i) only limited extracts of data or analysis be used; and (ii) any and all use of these statistics is accompanied by a citation to World Gold Council and, where appropriate, to Metals Focus, Refinitiv GFMS or other identified copyright owners, as their source. World Gold Council is affiliated with Metals Focus.

Neither the World Gold Council nor any of its affiliates (collectively, “WGC”) guarantees the accuracy or completeness of any information. WGC does not accept responsibility for any losses or damages arising directly or indirectly from the use of this information.

This information is for educational purposes only. Nothing contained herein is intended to constitute a recommendation, investment advice, or offer for the purchase or sale of gold, any gold-related products or services or any other products, services, securities or financial instruments (collectively, “Services”). This information does not take into account any investment objectives, financial situation or particular needs of any particular person.    

By receiving this information, you agree with the intended purpose of this information as being for educational purposes only.  Diversification does not guarantee any investment returns and does not eliminate the risk of loss.    

Investors should discuss their individual circumstances with their appropriate investment professionals before making any decision regarding any Services or investments.

This information contains forward-looking statements, such as statements which use the words “believes”, “expects”, “may”, or “suggests”, or similar terminology, which are based on current expectations and are subject to change. Forward-looking statements involve a number of risks and uncertainties. There can be no assurance that any forward-looking statements will be achieved. WGC assumes no responsibility for updating any forward-looking statements.

Information regarding QaurumSM and the Gold Valuation Framework 

Note that the resulting performance of various investment outcomes that can generated through use of Qaurum, the Gold Valuation Framework and other information are hypothetical in nature, may not reflect actual investment results and are not guarantees of future results. Diversification does not guarantee investment returns and does not eliminate the risk of loss.  World Gold Council and its affiliates and subsidiaries (collectively, “WGC”) provide no warranty or guarantee regarding the functionality of the tool, including without limitation any projections, estimates or calculations.