Summary
- Both the LBMA Gold Price AM in US dollars (USD) and the Shanghai Gold Benchmark Price PM (SHAUPM) in renminbi (RMB) ended the month lower, mainly due to strong performances in equity markets1
- China’s economic signals were mixed: while supply-side economic indicators continued to improve, demand showed a relatively slower recovery
- Au(T+D)’s volumes rose further due to the greater gold price volatility in early August. Chinese gold-backed ETFs’ total gold holdings increased by 4t in the month
- Wholesale gold demand in China rose in August as gold jewellery manufacturers were preparing for Chinese Valentine’s Day late in the month, and various promotional events during September2
- The Chinese local gold price discount recorded another record level of US$69/oz last month, as real rates in China and Western countries continued to diverge3
- The People’s Bank of China (PBoC) kept its gold reserves unchanged at 1,948t in August, accounting for 3.7% of its total reserves.
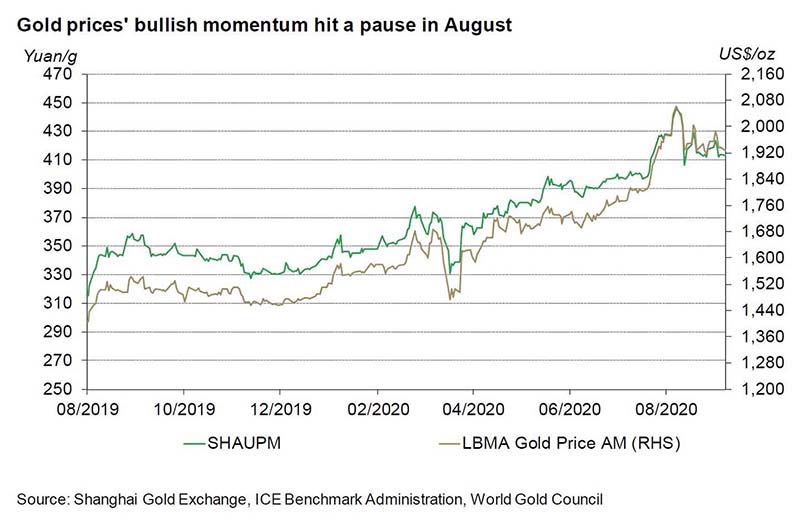
Bullish momentum in the gold price paused after it reached record highs in early August. Strong stock market performance, rising interest rates, and increased global economic activity created headwinds for the gold price. As a result, the LBMA Gold Price AM in USD and the SHAUPM in RMB fell 0.95% and 2.13% respectively in August. In addition, positive news around the development of a COVID-19 vaccine also raised optimism among investors.4
With RMB strengthening and Chinese Treasury yields rising further during the month – chiefly driven by the continued improvement in the domestic economy and policy makers’ prudent attitude towards monetary easing – the RMB-denominated gold price experienced a sharper decline than in USD.
Economic indicators sent mixed signals. While the manufacturing Purchasing Managers’ Index (PMI) continues to improve, the Producer Price Index (PPI) remained weak in August. In fact, PPI has been declining since February while the Consumer Price Index (CPI) experienced sharp drops. This could suggest that China’s fast economic recovery so far has primarily been driven by the supply side of the economy, as most factories resumed normal operation soon after the relatively swift containment of the COVID-19 outbreak in Q1 while demand had a slower recovery.
But with consumers’ real disposable income declining during the first half, the pandemic’s knock-on effects on the demand side of the economy unfolds. For instance, the service CPI fell on a y-o-y basis, whereas education, cultural and entertainment CPI’s y-o-y growth dropped to zero in August. As such, when the marginal improvement for the economy from the supply side diminishes, consumer demand – which recovered at a much slower pace than production – will be key to further economic growth.
Au(T+D)’s trading volumes rose in August, totaling 2,472t. With the local gold price hitting another record high, combined with higher price volatility in early August, many tactical investors took notice. Their interest contributed to the overall increase in the margin-traded contract’s trading volumes in the month. But as the momentum in the gold price cooled, Au(T+D)’s popularity in the second half of the month also declined.
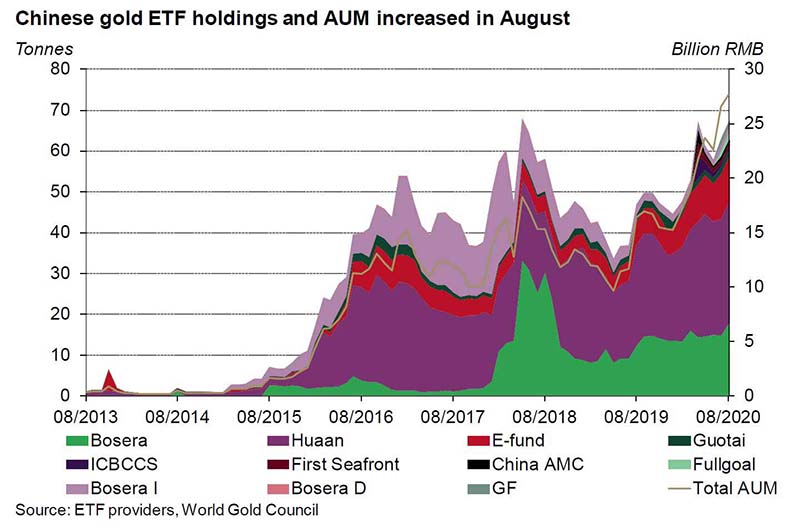
Chinese investors continued to add gold-backed ETFs to their portfolios. Total gold holdings in Chinese gold ETFs reached 64.3t – the second highest in history – in the month, a 4t m-o-m increase.5 Meanwhile, their assets under management (AUM) totalled US$4bn in August, eclipsing the previous record high of US$3.7bn made in July. Despite the strong performance of the equity market and a record-level local gold price, strategic investors kept up their gold allocation to hedge against possible future economic challenges.
The wholesale physical gold demand in China improved in August. This was primarily due to three key reasons. Firstly, Qixi – Chinese Valentine’s Day and a jewellery shopping occasion for young consumers – provided a boost for gold jewellery sales during the last week of the month, lifting wholesale demand as a result.
Secondly, even though the Shenzhen Jewellery Fair in September might not be as well attended as previous years due to the COVID-19 pandemic, many jewellery manufacturers in Shenzhen held their own promotion events, which attracted lots of retailers from all over the country.
The Chinese local gold price discount widened to the largest ever. The SHAUPM was US$69/oz cheaper than the LBMA Gold Price AM in August on average, a widening of the discount by more than 200% m-o-m.
Note: SHAUPM vs LBMA Gold Price AM after April 2014; before that, Au9999 vs LBMA Gold Price AM is used.
Click here for more.
As mentioned in my previous blog, the diverging real rates in China and Western countries such as the US – possibly a result of the faster economic recovery in China – might be the key driver for the acceleration in the widening of the discount despite an uptick in local gold wholesale demand. In other words, Chinese investors’ opportunity cost to hold gold is relatively higher than Western investors’.
Note: China’s real rate = China’s 10-year Treasury yield minus inflation; US real rate = US 10-year Treasury real yield; Europe real rate = Europe 10-year Treasury yield less inflation.
There was no change in the PBoC’s gold reserves in August. The PBoC’s foreign reserves totalled US$3,164.6bn as of July, US$10.2bn higher than July, according to the State Administration of Foreign Exchange (SAFE). The PBoC’s gold reserve has remained unchanged at 1,948t since September 2019 and currently makes up 3.7% of total reserves.
Footnotes
We compare the LBMA Gold Price AM to SHAUPM because the trading windows used to determine them are closer to each other than those for the LBMA Gold Price PM. For more information about Shanghai Gold Benchmark Prices, please visit www.en.sge.com.cn/data_BenchmarkPrice.
Qixi – Chinese Valentine’s Day – was on 25th August 2020.
For more information about premium calculation, please visit www.gold.org/goldhub/data/local-gold-price-premiumdiscount.
For more information, please visit: www.cbsnews.com/news/covid-vaccine-russia-coronavirus-development/.
Please note that Bosera’s I & D shares only provide updates at the end of each quarter.


