China’s gold market in May: gold ETFs continued to attract attention while consumption cooled
13 June, 2024
Key highlights:
- The Shanghai Gold Benchmark PM (SHAUPM) in RMB and the LBMA Gold Price AM in USD edged higher in May – but both price increases narrowed. Gold’s momentum has continued to ease so far in June and prices have experienced a mild loss
- The industry withdrew 82t of gold from the Shanghai Gold Exchange (SGE), notably lower both m/m and y/y amid cooling demand for gold jewellery as well as bar and coin investment. Meanwhile, gold trading activities at the Shanghai Futures Exchange also decelerated
- The average monthly gold price premium in China fell by US$10/oz m/m, reflecting weakening wholesale demand
- Chinese gold ETFs added RMB1.8bn (US$253mn) in May, extending their inflow streak to six months and pushing their total assets under management (AUM) to a record high. Meanwhile, collective holdings now stand at 87t, also the highest in history
- The People’s Bank of China (PBoC) reported no gold purchases in May, bringing its 18-month buying streak to a close. Currently, China’s total official gold holdings remain at 2,264t, or 4.9% of the nation’s total reserves, the highest ever.
Looking ahead
- The local gold price, which remains elevated despite the recent correction, may continue to suppress gold jewellery consumption and further divert consumers to lighter and cheaper products. And we don’t expect wholesale demand to pick up until mid-to-late Q3, when manufacturers and retailers replenish for the National Day Holiday sales boost
- Although bar and coin sales have cooled recently, we believe heightened geopolitical risks, as well as the fact that gold has been a strong-performing non-RMB and global asset, should continue to attract investors. But in the short term, investment demand for gold may be negatively impacted by the recent price correction – which may push undecided investors to the sidelines.
Gold prices edged higher in May
Gold extended its strength in May albeit with a narrower increase than in recent months (Chart 1). Both the LBMA Gold Price AM in USD and the SHAUPM in RMB rose by 1% last month. The weakening dollar, lower yields and improved gold ETF demand drove gold’s strength during the month.
During the first week of June, impacted by slowing central bank purchases and changing investor expectation of the US Fed’s future rate cuts, the LBMA Gold Price AM in USD fell by 2%. Meanwhile, the SHAUPM in RMB saw a 1% rise amid the weaker local currency.
Chart 1: Gold continued to climb in May
Monthly changes in the SHAUPM and LBMA Gold Price AM*
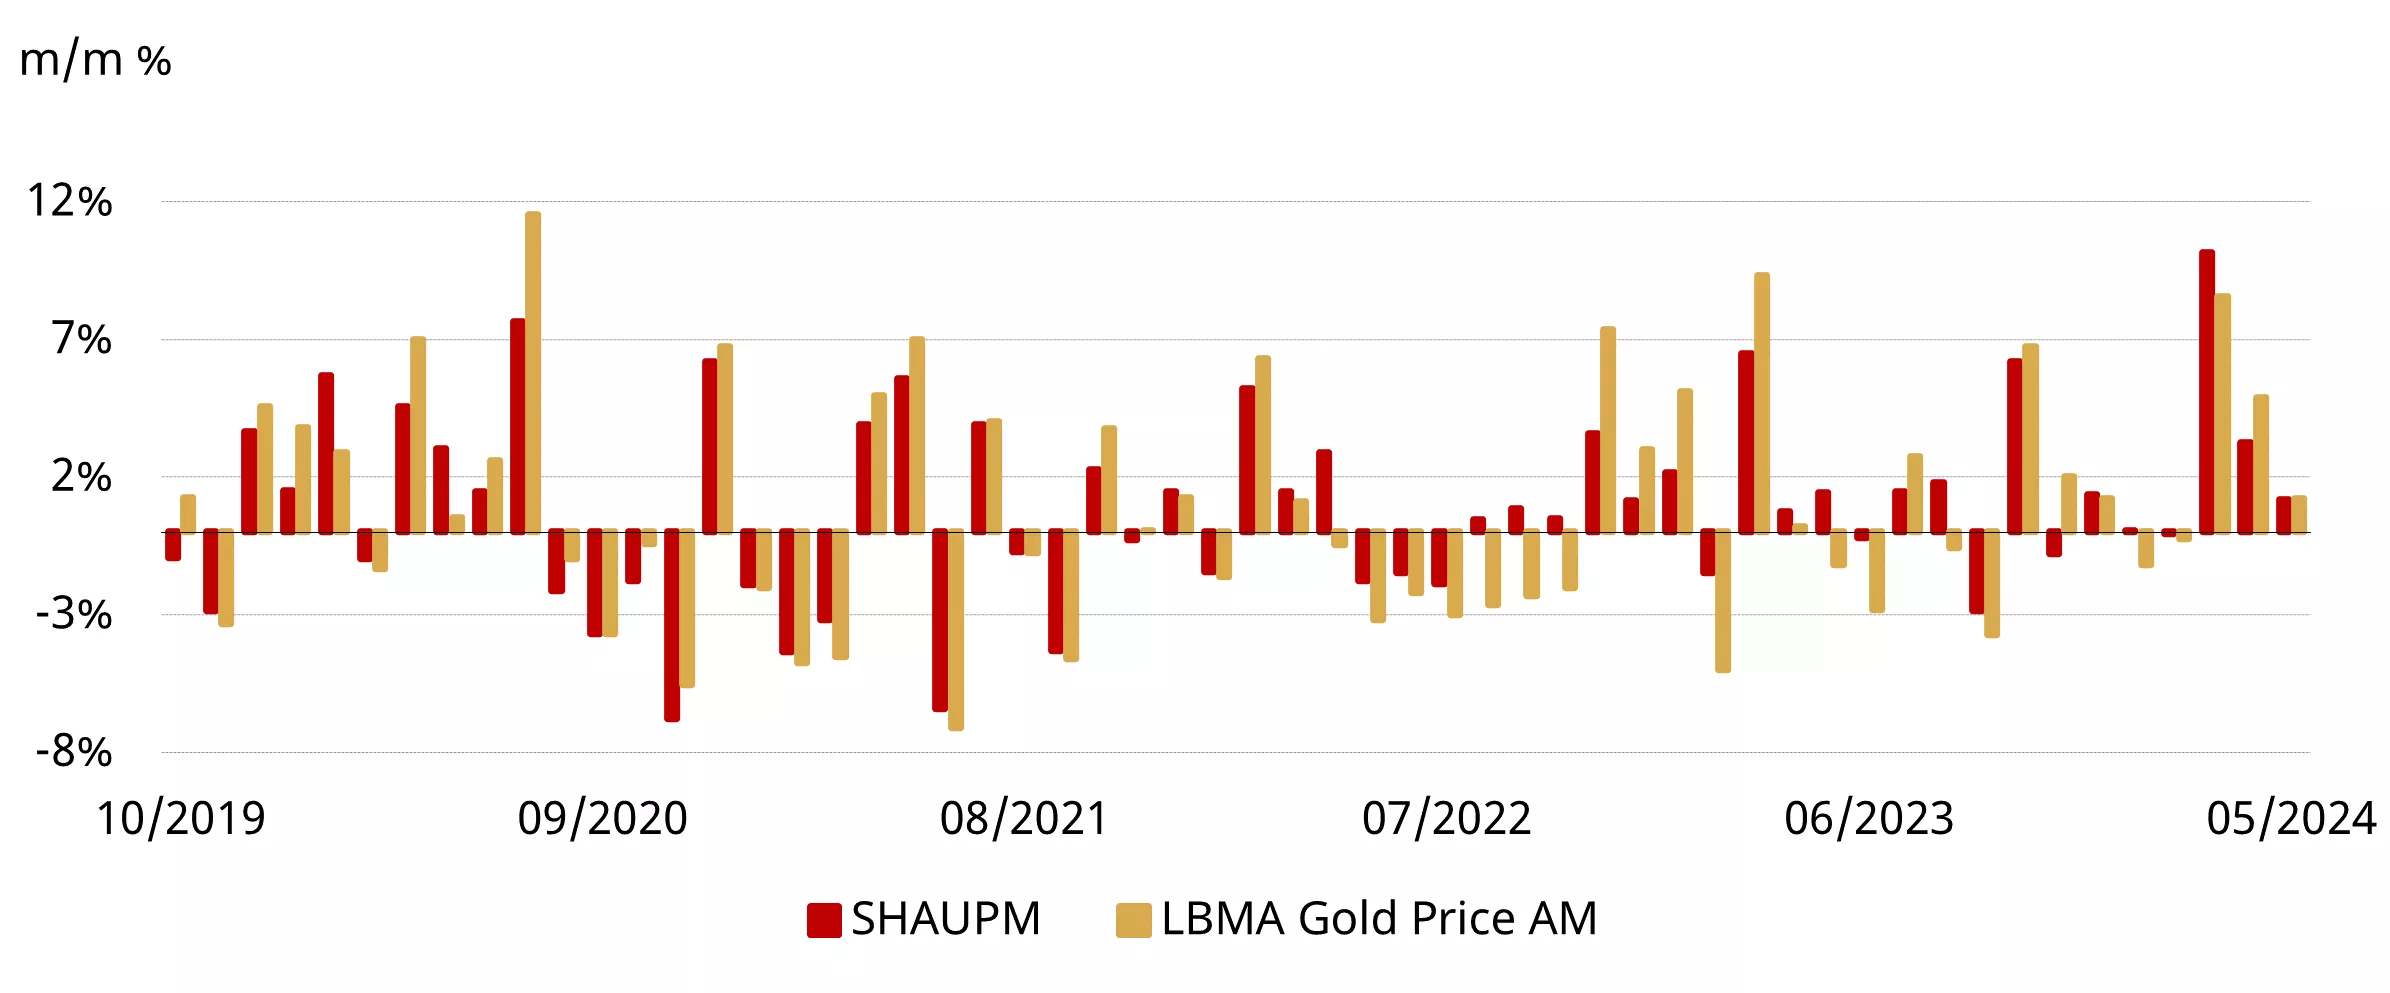
*Note: We compare the LBMA Gold Price AM to SHAUPM because the trading windows used to determine them are closer to each other than those for the LBMA Gold Price PM. For more information about Shanghai Gold Benchmark Prices please visit Shanghai Gold Exchange.
Source: Bloomberg, Shanghai Gold Exchange, World Gold Council
During the first five months of 2024, gold in RMB has surged by more than 15%, outperforming all major assets in China (Chart 2). Robust demand, geopolitical risk spikes, RMB weakness, and the prospect of a global easing cycle ahead, were the main drivers of gold’s strength.
Chart 2: Gold remains the top performing RMB asset in 2024
Major asset performance so far in 2024*
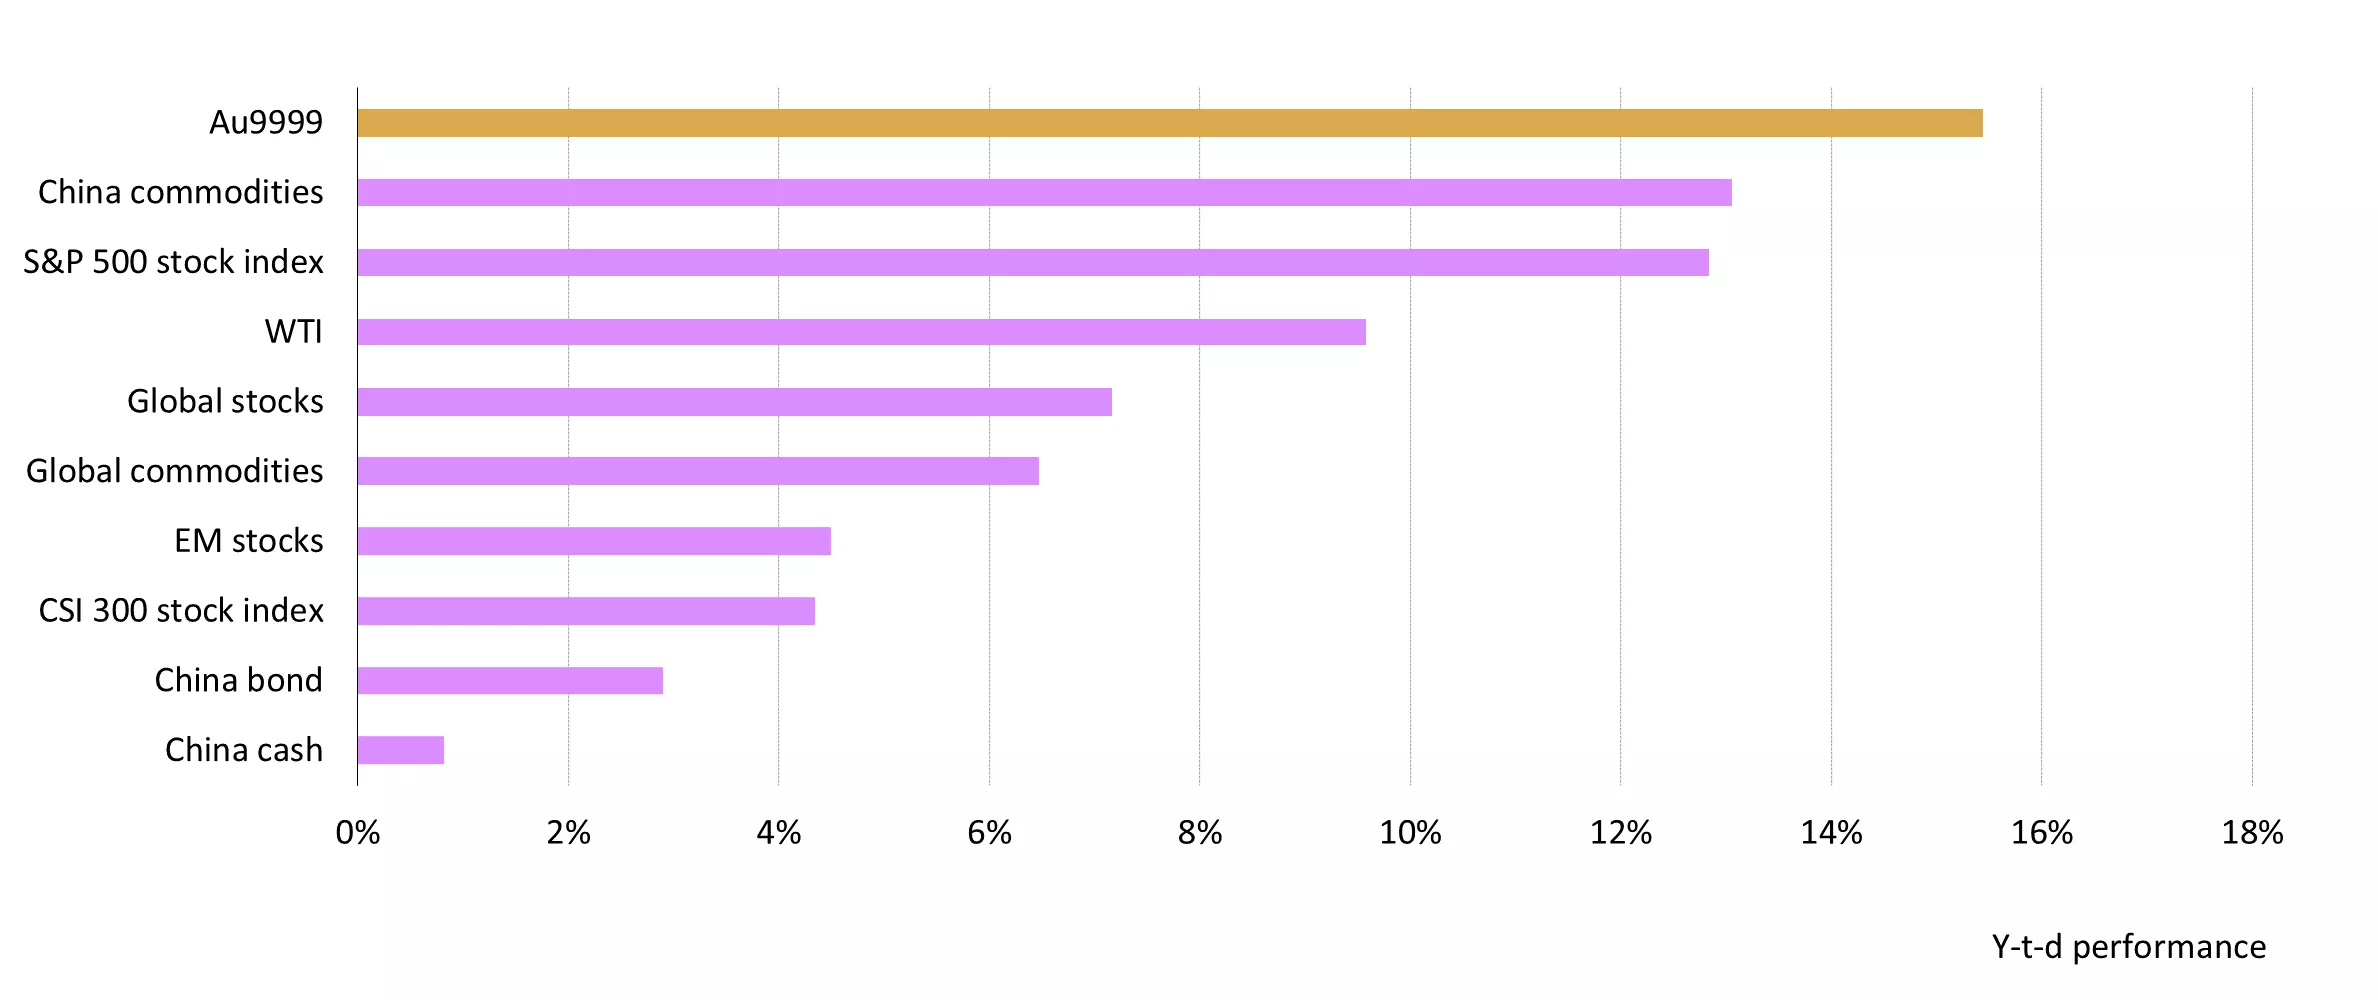
*As of 31 May 2024; all calculations in RMB. Based on the SHAUPM, S&P 500 Index, WTI Crude Oil, Bloomberg US Treasury Agg, CSI China Money Market Fund Index, Wind China Commodity Index, Bloomberg China Bond Aggregate, Shanghai Shenzhen 300 Stock Index, and the ChiNext Stock Index.
Source: Bloomberg, Shanghai Gold Exchange, World Gold Council
Demand cooled in May
Gold withdrawals from the SGE amounted to 82t in May, 49t lower m/m and 30t lower y/y. As noted in our previous blog, the elevated gold price dimmed consumer interest in gold jewellery, leading to weaker-than-expected sales during the five-day International Labour Day Holiday in early May – a traditional demand boost – and this trend continued for the rest of the month. The cooling momentum in the gold price surge also pushed trend-following physical bar and coin investors to the sidelines, as they wait for the uptrend to re-emerge.
Consequently, wholesale gold demand experienced its weakest May since 2020 – when demand was affected by the COVID pandemic – ending the month 34% below the 10-year average. Nonetheless, due to demand strength earlier this year, gold withdrawals have totalled 736t so far in 2024, 35t higher y/y.
Chart 3: The industry withdrew less gold in May amid cooling demand
Gold withdrawals from the SGE in 2024 and the 10-year average*

*10-year average based on data between 2014 and 2023.
Source: Shanghai Gold Exchange, World Gold Council
Following the surge in April, trading volumes of Shanghai Futures Exchange’s active gold future contract cooled – averaging 193t per day in May, a 44% m/m fall. However, volumes remain well above the five-year average of 163t.
Chart 4: Gold future trading activities also cooled in May
Active gold future contract volume and the five-year average*
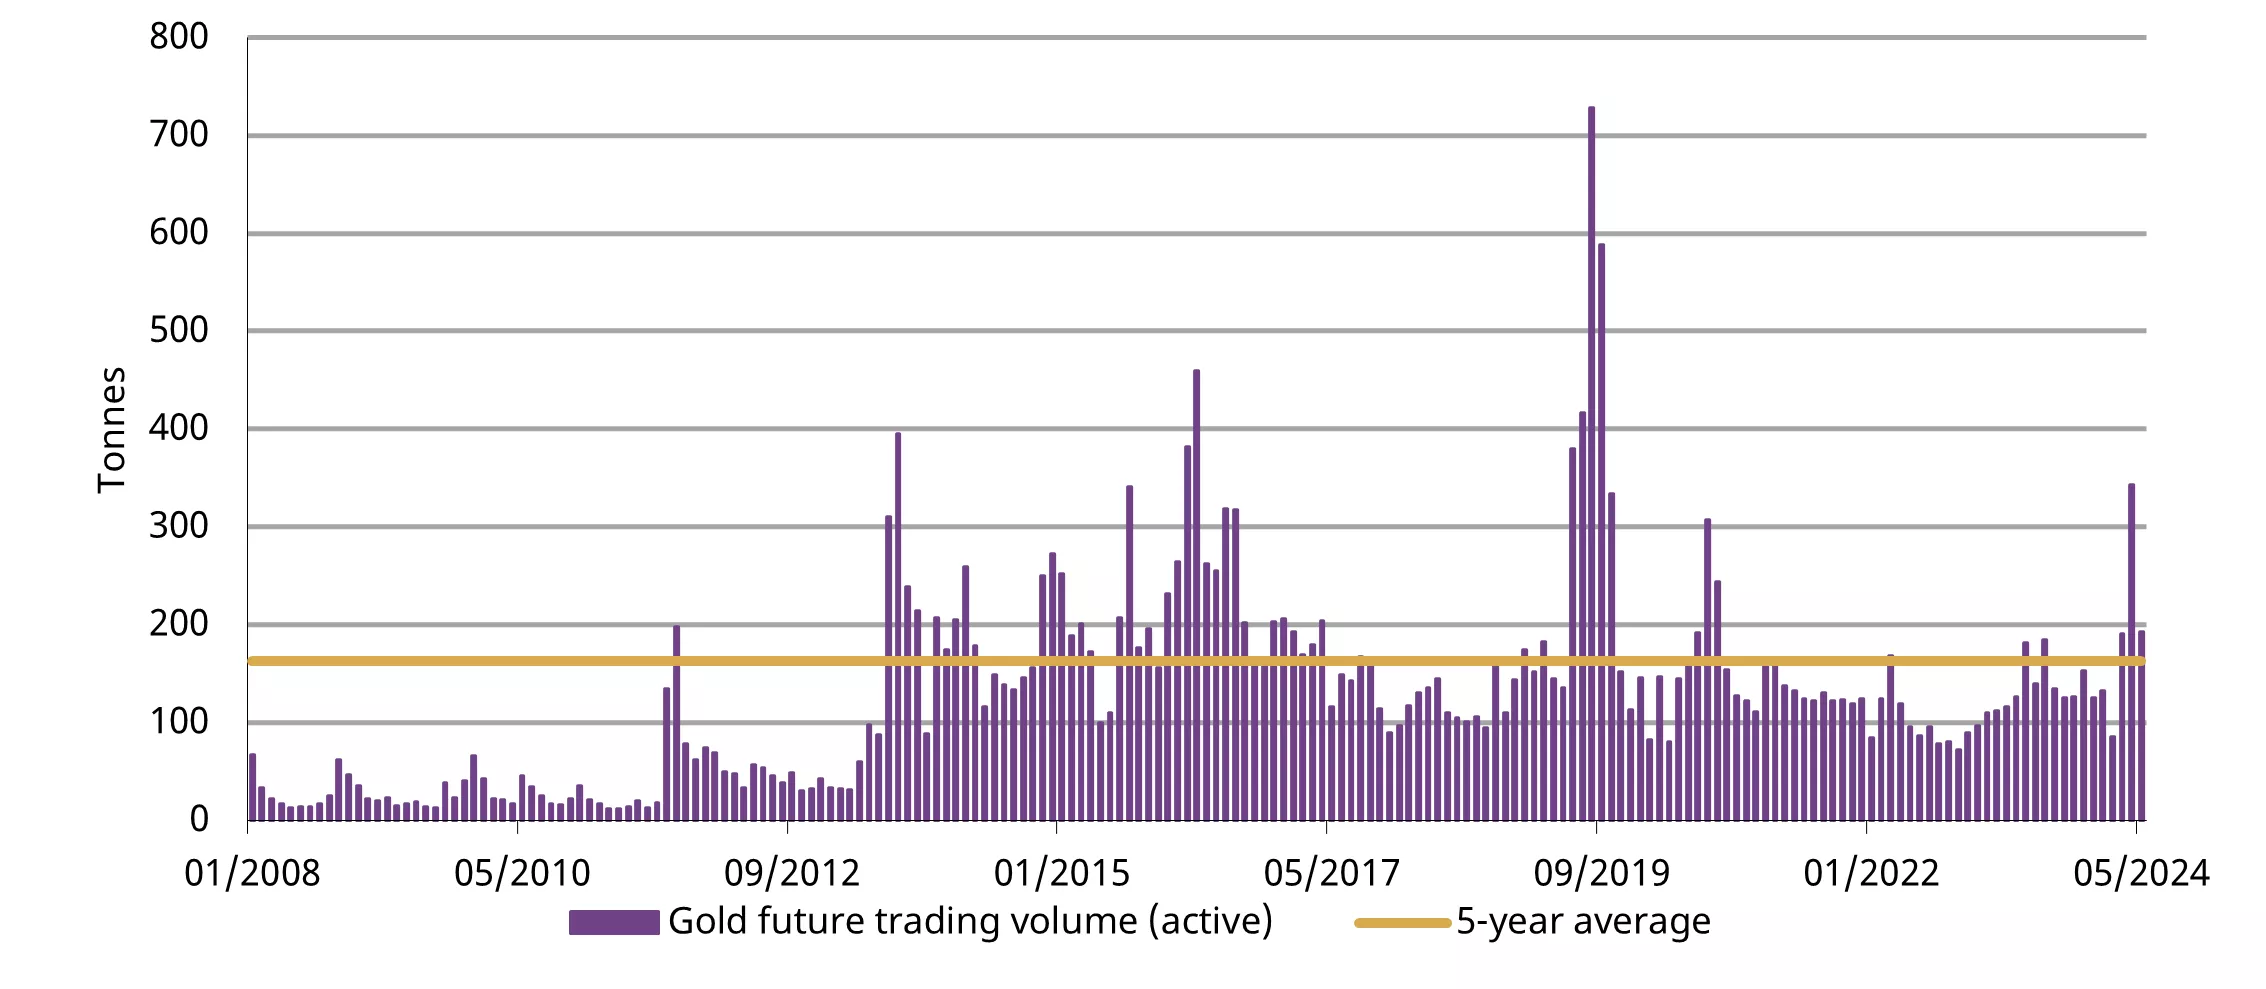
*Based on monthly average daily trading volumes in lots of contracts and the average active gold future contract close.
Source: Shanghai Futures Exchange, World Gold Council
The local premium fell
On average, the Chinese gold price premium fell to US$32/oz in May, US$10/oz lower m/m (Chart 5). The m/m drop was mainly driven by weakening wholesale demand as mentioned above.
Chart 5: The local gold price premium lowered in May
The monthly average spread between SHAUPM and LBMA Gold Price AM in US$/oz and %*
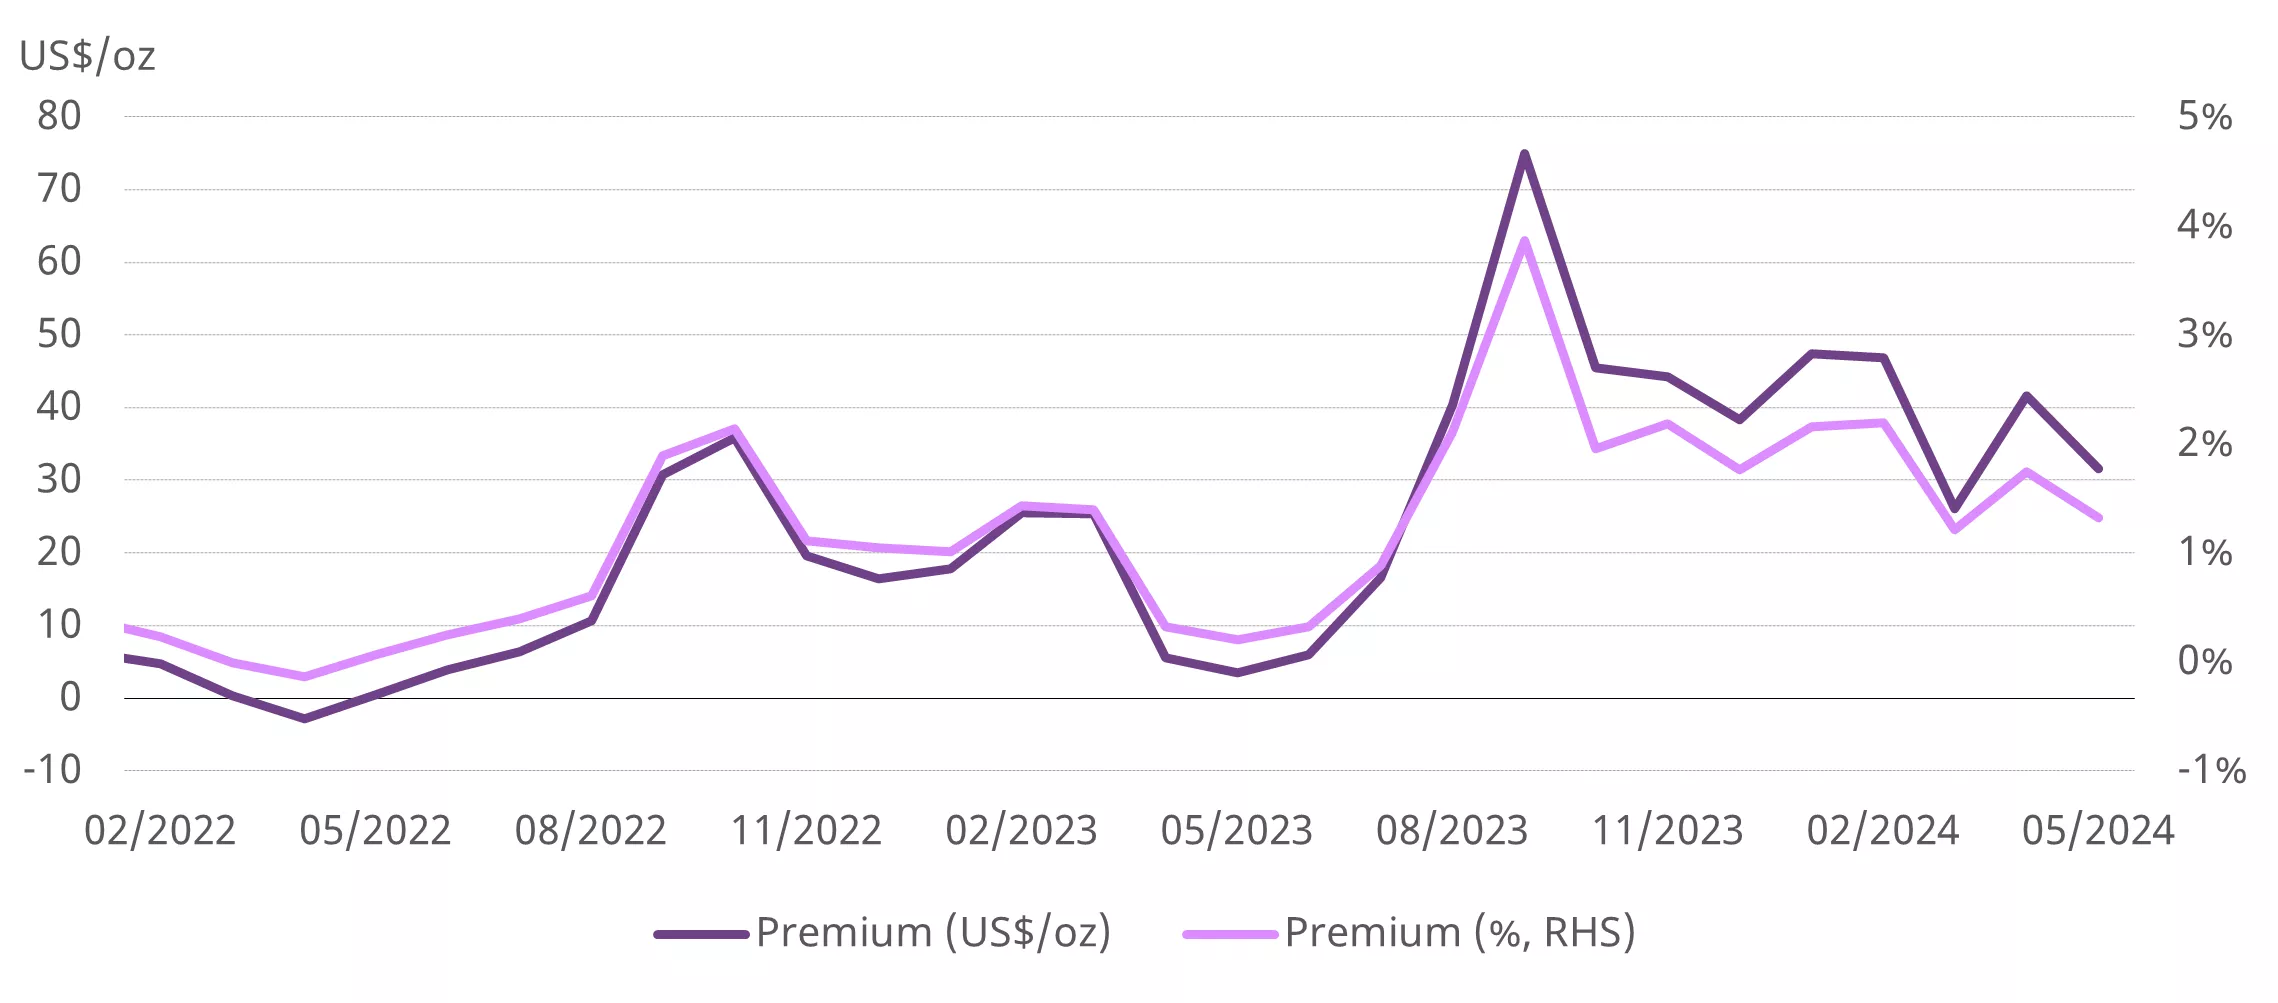
*Before April 2014 the spread calculation was based on Au9999 and LBMA Gold Price AM; click here for more.
Source: Bloomberg, Shanghai Gold Exchange, World Gold Council
But Chinese gold ETFs saw continued inflows
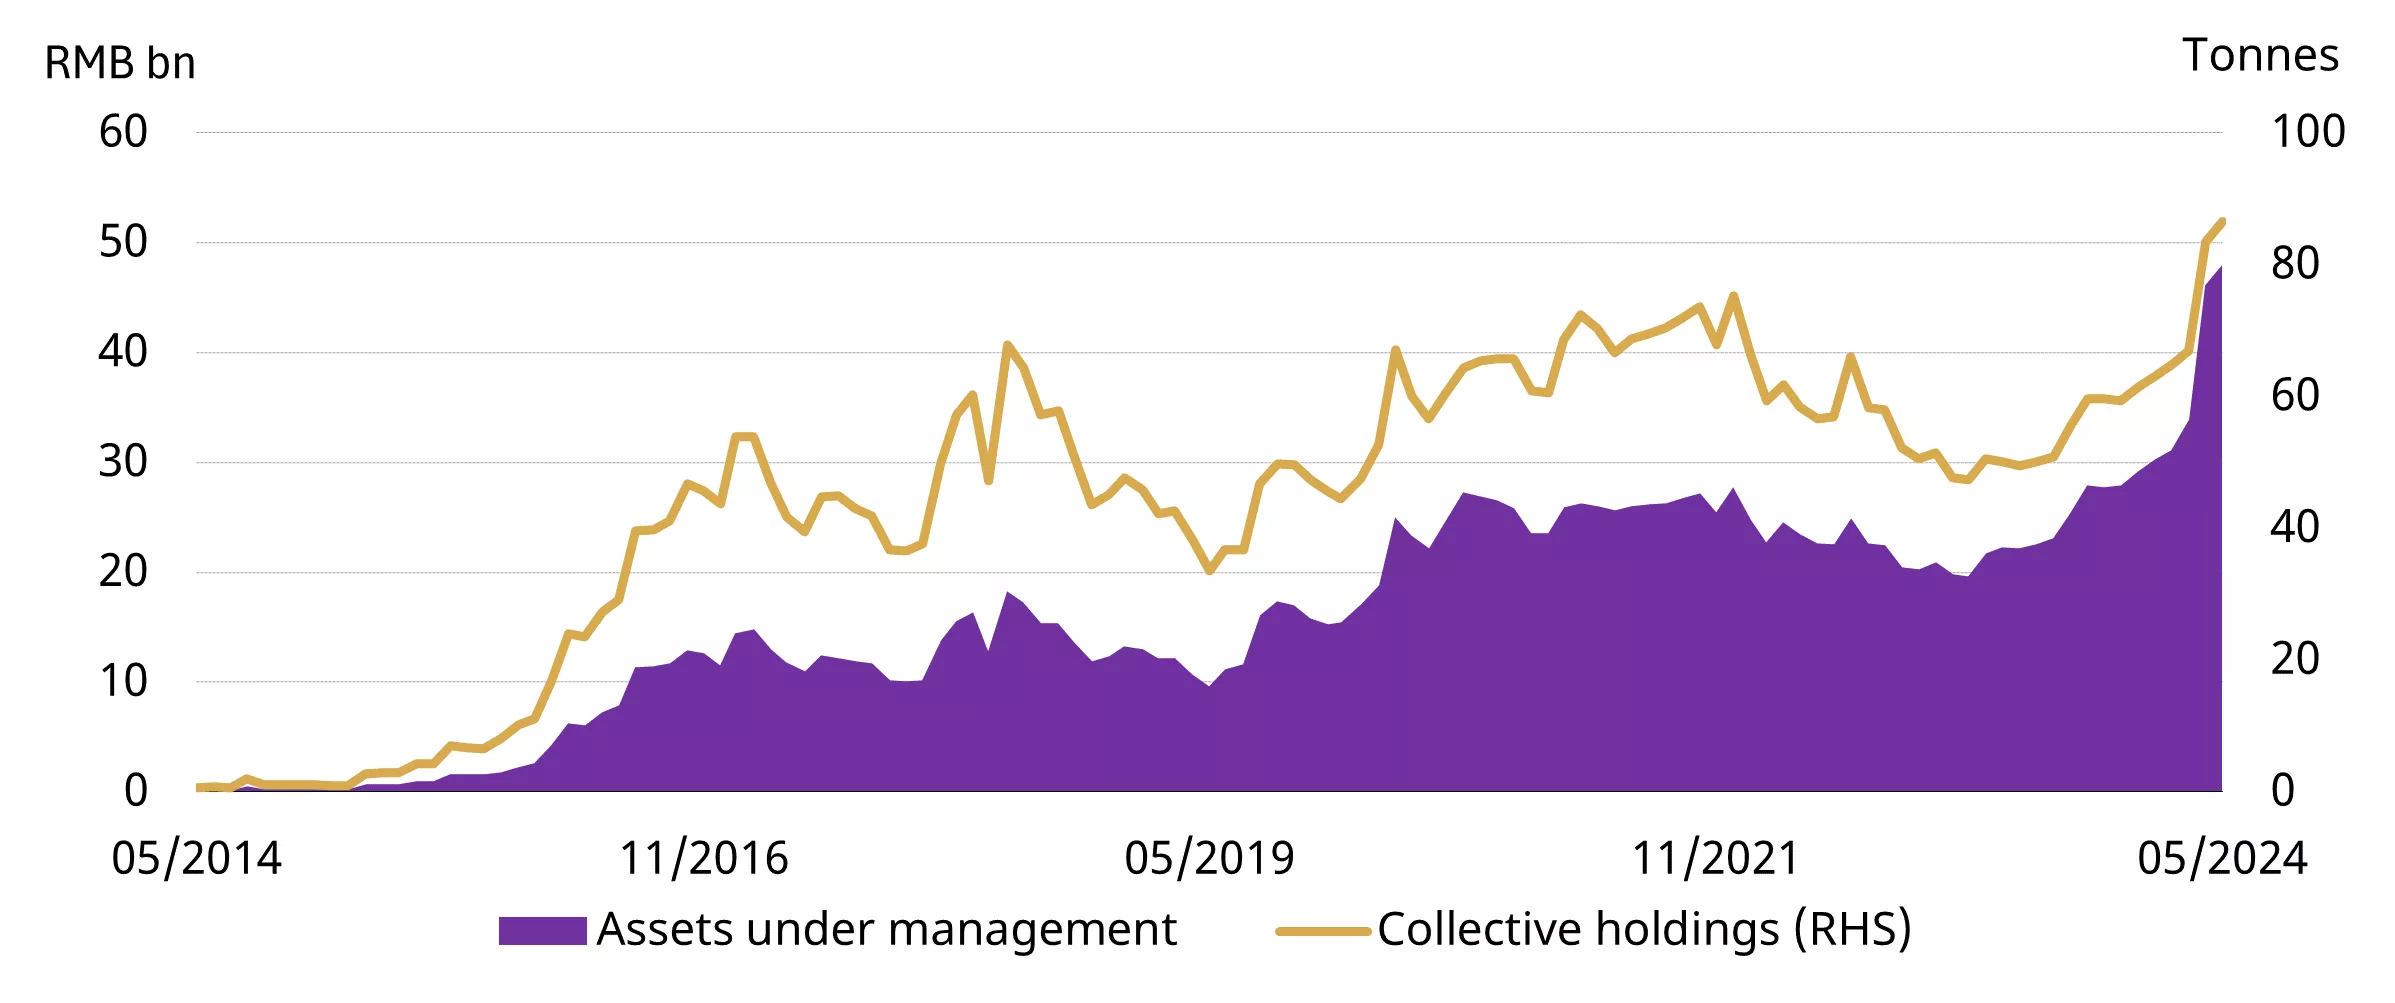
Chinese gold ETFs added RMB1.8bn (US$253mn) in May, the sixth consecutive monthly inflow. May pushed the total AUM to RMB48bn (US$6.7bn), another record high, and collective holdings increased by 3t to 87t, also the highest ever (Chart 6). Sliding equities, the weakening local currency, as well as the downtrend in Chinese government bond yields, all led investors to gold. Interestingly, we noticed accelerating inflows towards the end of the month when the gold price corrected, showing signs of “dip buying”, which had been the main pattern prior to 2020.
Chinese funds have attracted RMB14bn (US$2bn) y-t-d, pushing total AUM and holdings 41% and 65% higher, respectively.
Chart 6: Chinese gold ETF AUM and holdings both rose to the highest ever
Chinese gold ETF AUM and holdings
Source: ETF providers, Shanghai Gold Exchange, World Gold Council
China’s official gold reserves remained unchanged in May
The PBoC’s gold reserves stood at 2,264t at the end of May; the first month in which there has been no announcement of gold buying since November 2022 (Chart 7). Gold now accounts for 4.93% of China’s total official reserves, the highest ever thanks to May’s gold price strength. The PBOC stated gold reserve increase remains at 29t y-t-d, representing a 1.3% rise in holdings during the same period.
Chart 7: Gold’s share of China’s reserves saw no change in May
Official gold reserves (tonnage) and their share of total foreign exchange reserves*
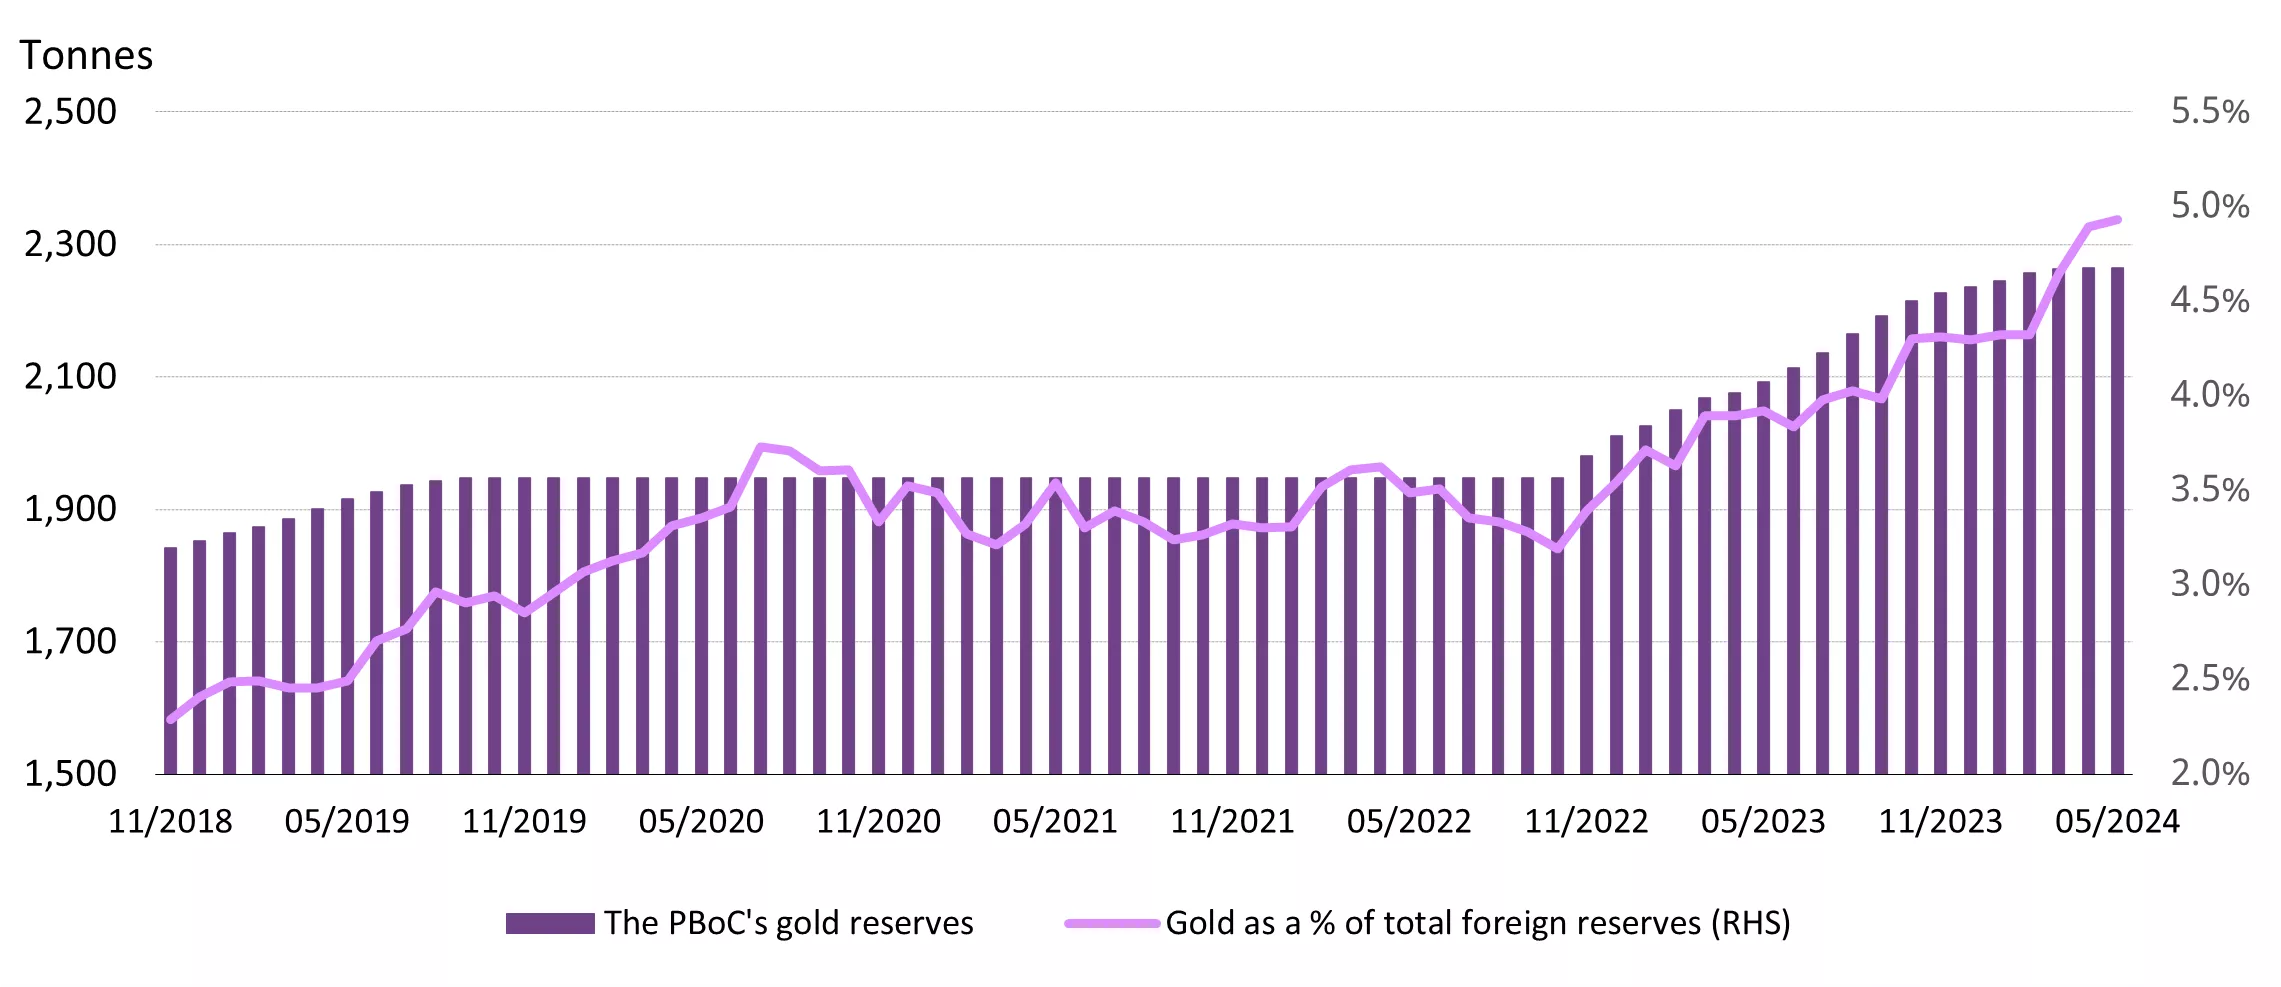
*Gold’s share of total foreign exchange reserves is based on values in USD.
Source: PBoC, World Gold Council
Imports were marginally lower in April
Gold imports into China totalled 77t in April, 8t lower m/m and a 24t fall y/y. We believe this was mainly a result of weaker gold jewellery demand during the month. As we noted previously, with the local gold price hovering around the highest on record in April, consumers chose to wait on the sidelines.
Nonetheless, imports held up relatively well during past months when the gold price surged – investment demand strength has partially cancelled out gold jewellery consumption slowdown.
Chart 8: Gold imports fell in April*
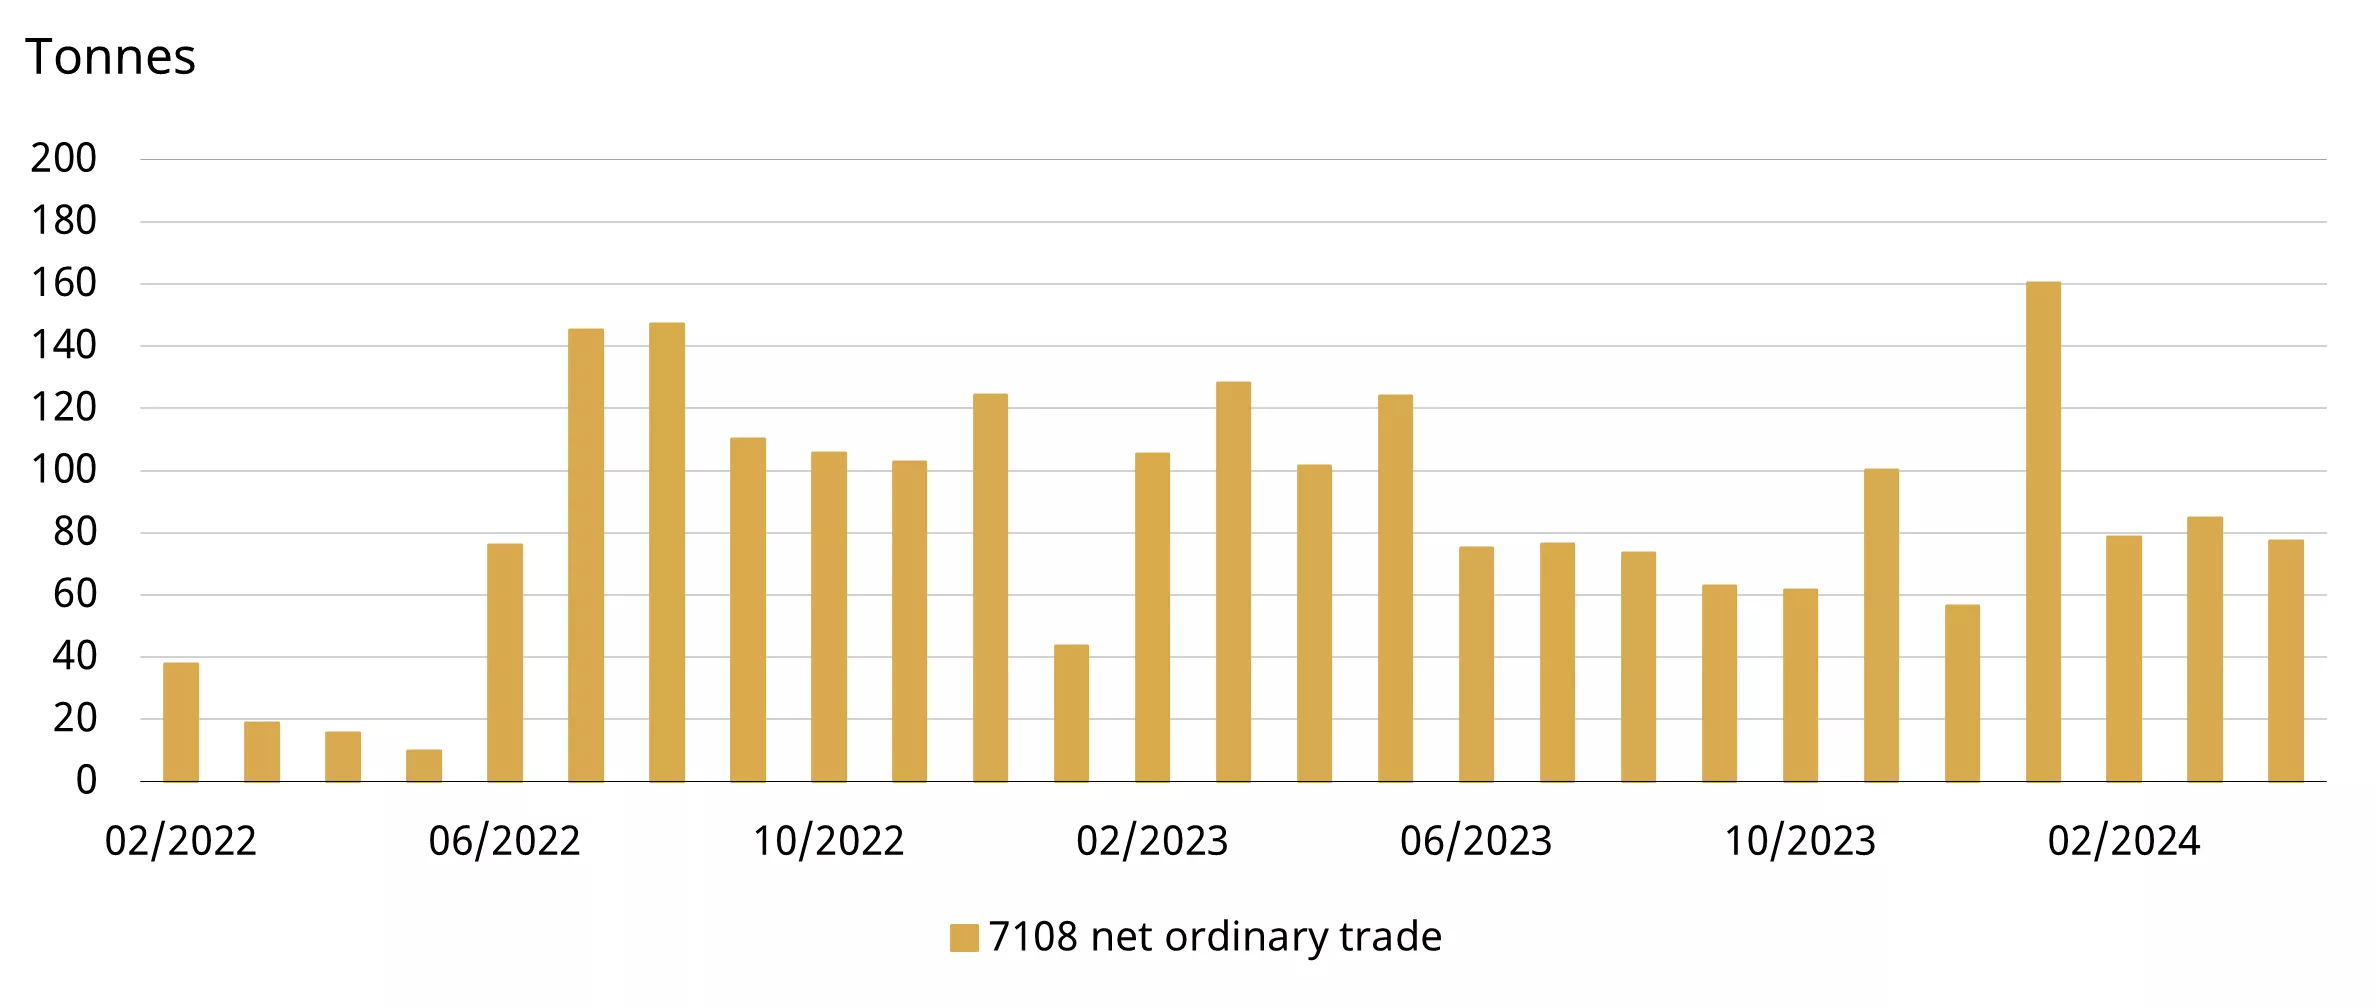
*Based on ordinary trades under HS code 7108 reported by China Customs, excluding exports.
Source: China Customs, World Gold Council
