Let's Tally the Rally
4 November, 2024
No let up in October
Gold made further gains in October, smashing through previous record highs to finish up 4.0% at US$2,734/oz (Table 1).
The rally occurred amid unusual mutual gains in the US dollar, bond yields and equities. This was reflected in the large residual shown in our Gold Return Attribution Model (GRAM) – see Chart 1. According to GRAM, yield- and FX-related opportunity cost factors were a drag on the price alongside momentum, with only risk and uncertainty – and the ever present economic expansion – contributing positively to its return, via a combination of higher breakeven inflation and geopolitical risk.
Chart 5 shows that much of gold’s price action took place during late Asian/early European trading hours. This at least partly explains the increasingly frequent disconnect between gold’s return and its usually reliable – yet US-centric – short-term drivers of rates and the US dollar. A risk premium ahead of US elections is also a likely driver. Global gold ETFs experienced further inflows in October led by the US and China, but North American inflows (30t as of 31 October) were more than offset by COMEX futures positions, which pared 40t over the month, lending credence to the idea that October was mostly an Asia story.
Table 1: No let up for gold’s strong run in October, reflected in major currencies as the US dollar also gained
Performance of gold in various currencies*

*Data to 31 October 2024. Based on the LBMA Gold Price PM in USD, expressed in local currencies.
Source: Bloomberg, ICE Benchmark Administration, World Gold Council
Chart 1: Gold bucked strength in the US dollar and Treasury yields, as geopolitical and high Asian hours activity drove returns in October
Multifactor model detailing attribution of gold’s drivers on its monthly returns*
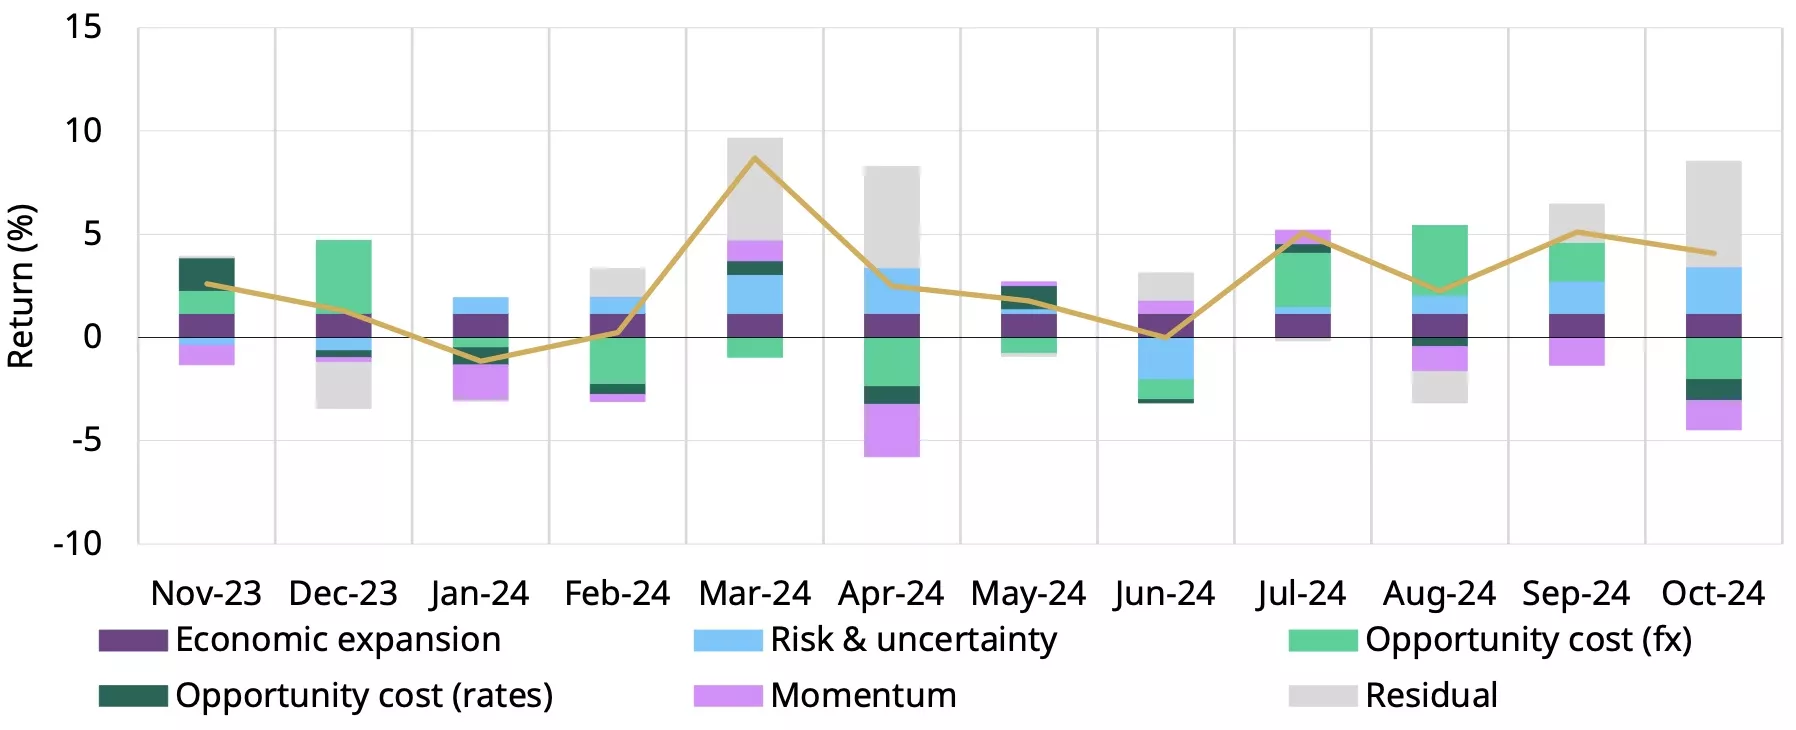
*Data to 31 October 2024. Our Gold Return Attribution Model (GRAM) is a multiple regression model of gold price returns, grouped into four thematic driver categories of gold’s performance: economic expansion, risk & uncertainty, opportunity cost, and momentum. These themes capture motives behind gold demand; most importantly, investment demand, which is considered the marginal driver of returns in the short run. ‘Residual’ captures the share of gold returns that is not explained by factors already included. Results shown here are based on analysis covering an estimation period from October 2019 to October 2024. We have reduced the estimated window to five years to better reflect current conditions.
Source: Bloomberg, World Gold Council
Gold and the US election
US elections take place this week and could spark some volatility across markets. There is probably little to be gained in having conviction in asset trajectories during such a polarised and binary event, so we suspect that many investors quite like the safety of gold and other hedges in such circumstances.
Our recent analysis found no discernible pattern in gold’s near-term reactions to past elections. It was only when the dust settled and policy shifts – both fiscal and monetary – became clear, that gold took its cues. We remain of the opinion that the fiscal plans proposed under both administrations will continue to attract investors to gold.
Let’s tally the rally
As we are delaying our Gold Market Commentary until after the election, we wanted to provide an early look back at gold’s phenomenal run in 2024 – by the numbers.
Top performer
Gold has had a stellar year as one of the best performing assets in 2024, made all the more remarkable given a positive performance by risk assets, a stronger US dollar and elevated bond yields (Chart 2). The price was boosted by:
- Central bank buying fervour
- Resilient-to-strong Asian demand including Chinese bar and coin buying and Indian buyers taking advantage of import duty cuts. Our most recent Gold Demand Trends report lays this out nicely
- Geopolitical tension - from significant elections to conflict in the Middle East – encouraging buying and restraining the selling back of gold.
Chart 2: Gold has been one of the best performing assets in 2024
Y-t-d performance of various assets, in US$
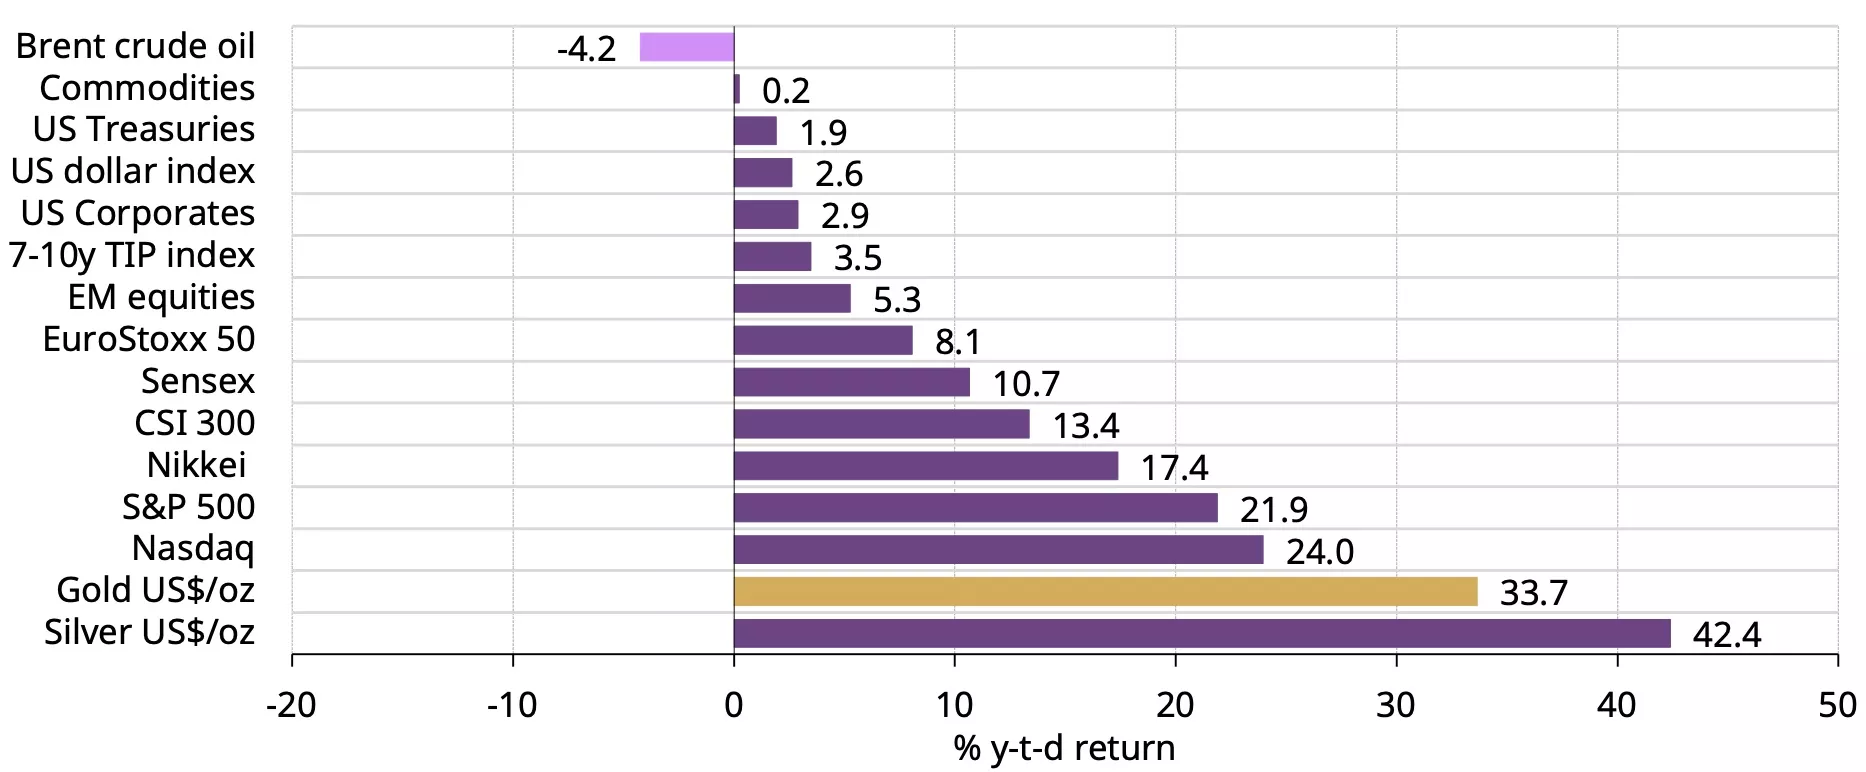
*Data from 1 January 2024 to 31 October 2024
Source: Bloomberg, World Gold Council
Higher highs
Gold has posted 39 new all-time highs in US dollars this year, second only to 1979 (57) and closely followed by 1972 (38) and 2011 (38) (Chart 3). March, September and October saw the largest number of new highs (8). These may be throwaway statistics to some but they often matter in driving media coverage and sentiment: who doesn’t like reading about records being broken? But, there are some noteworthy differences. For one, previous record-setting years have been accompanied by strong investment demand. Gold ETF inflows in Western markets are very late to the party this year, and retail investment demand has not picked up much either. Furthermore, media fervour is not as visible today as it was during 2020 when gold made its first new all-time-highs for nigh-on a decade, suggesting perhaps that this time, sentiment has not gotten carried away (Chart 4).
Chart 3: Gold has made 39 new highs, the second highest annual tally on record
Gold price and new all-time-high closes*
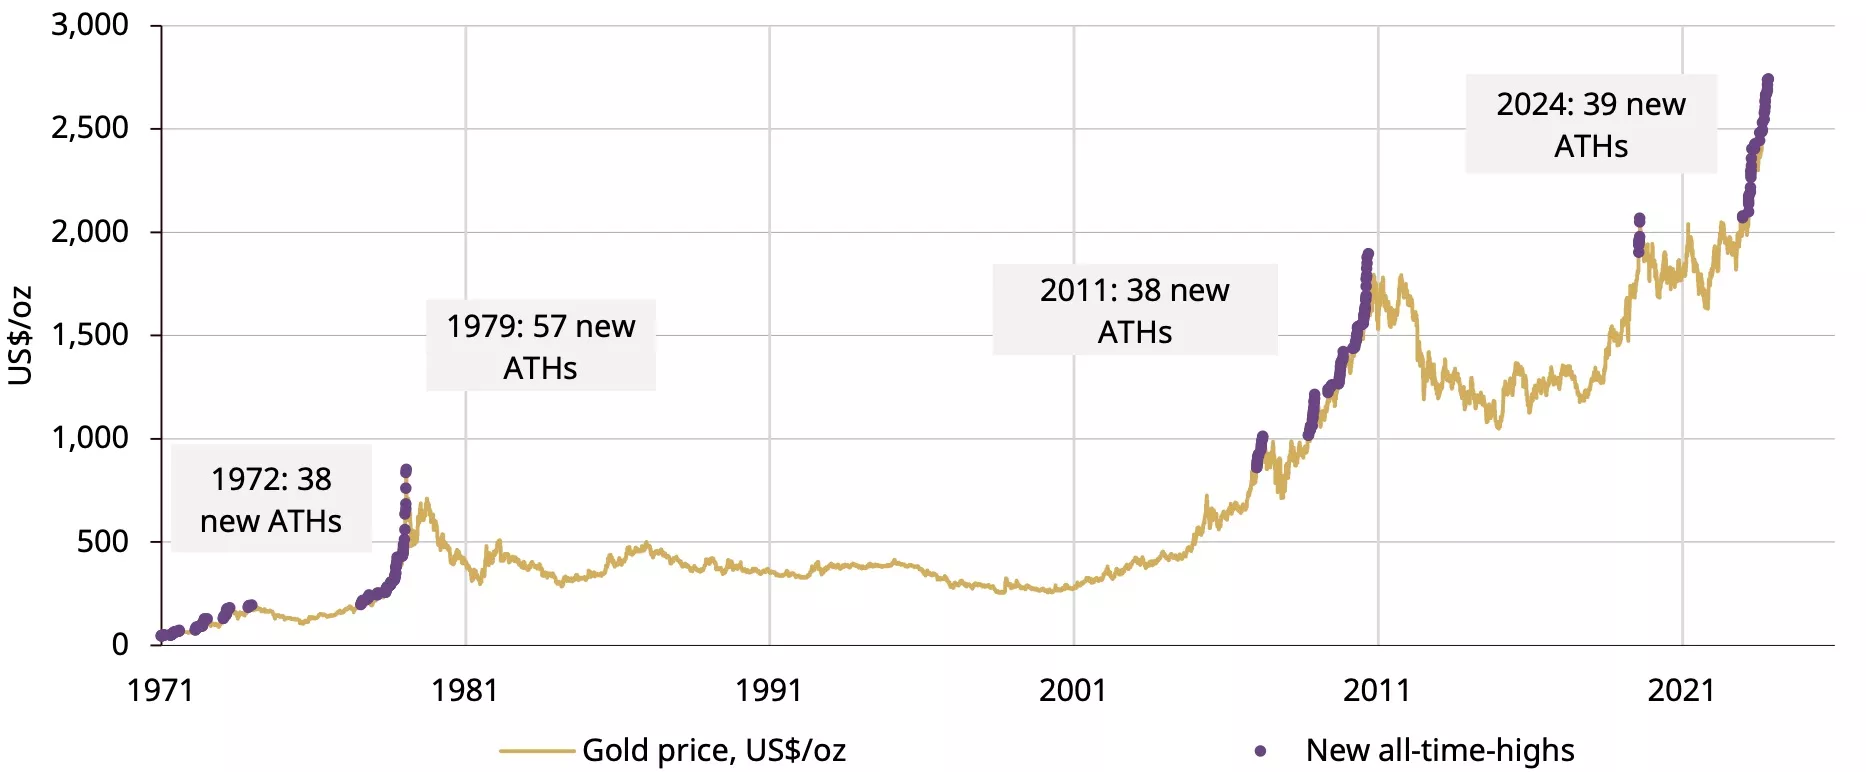
*Data from 31 December 1971 to 31 October 2024.
Source: Bloomberg, World Gold Council
Chart 4: Repeated new highs have failed to excite media as much as during the 2020 run-up
News, social media and Bloomberg word search for “gold”

Source: Bloomberg
Time is of the essence
The largest contributions to returns during October were recorded during Asian trading hours (Chart 5). Yet most of gold’s volatility occurred during European and US sessions (Chart 6), consistent with the narrative of emerging market investors and central bank buying helping to drive prices higher even as trading in Western markets, as it tends to do, creates the most short-term noise.
Chart 5: Gold’s return has been driven mostly during Asian trading hours in 2024 – and notably in October
20-minute intraday spot gold mid-price cumulative returns divided into regional trading sessions*
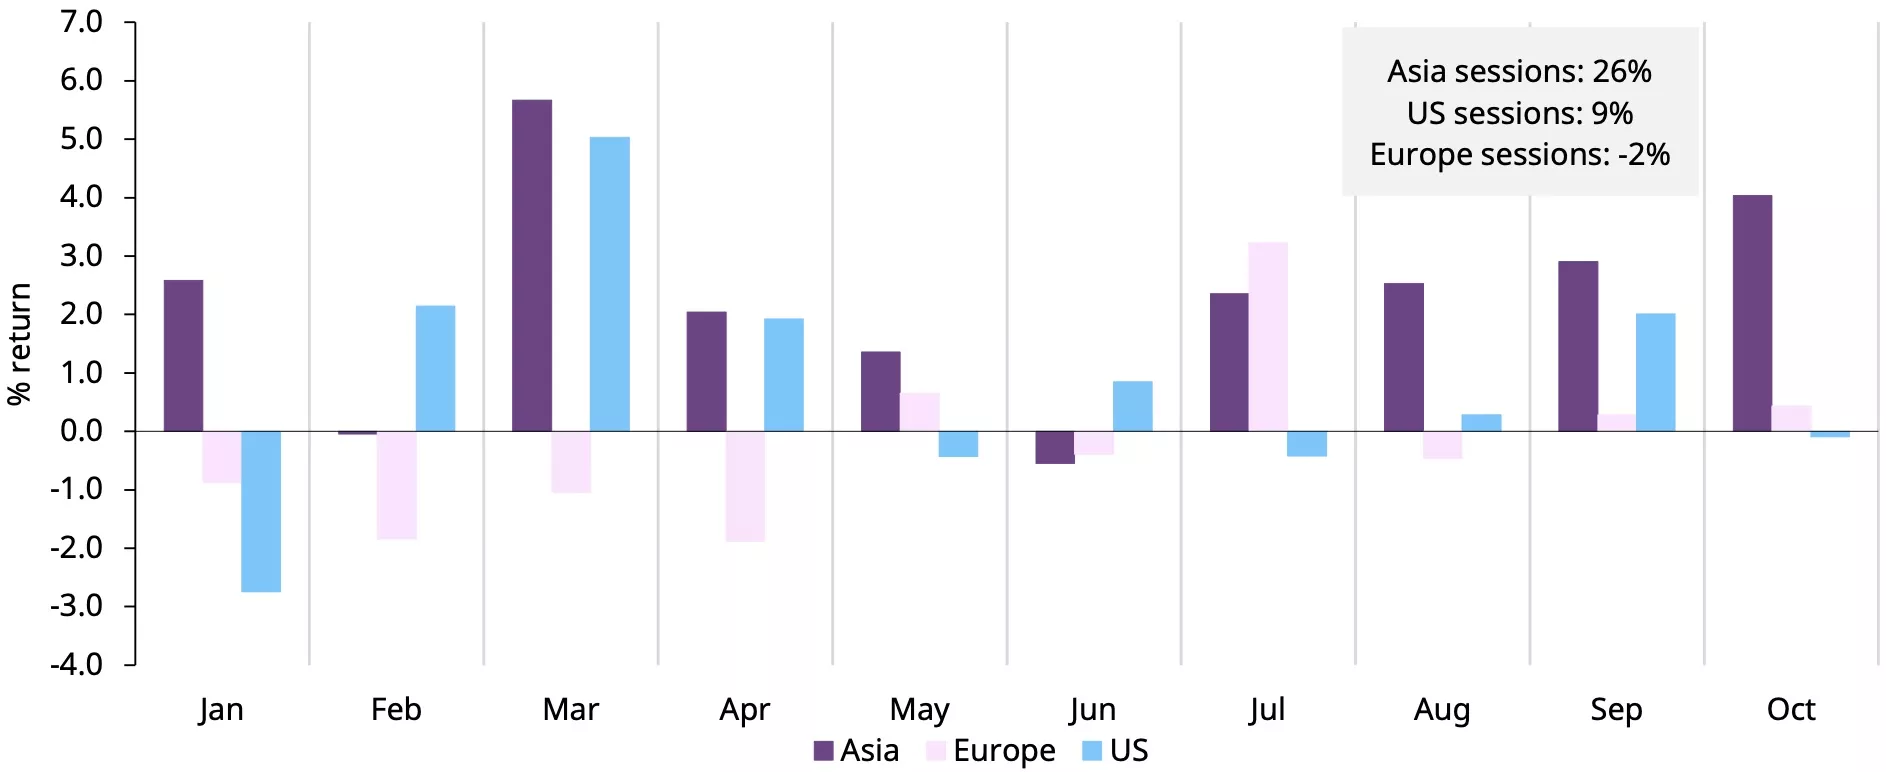
*Data from 1 January 2024 to 31 October 2024. Gold spot mid-price at 20-minute intervals. Sessions: Asia 2200 to 1100 UTC, Europe: 1100 to 1400 UTC, US: 1400 to 2200. Asia session runs from 22:00 UTC to 1100 UTC, overlapping with normal European trading hours, given that much of larger Asia gold trade is likely to take place at the LBMA AM benchmark price at 1100 UTC. Asian trading hours remain the largest contributor, albeit to a lesser extent if we end the session at 0700 UTC.
Source: Factset, World Gold Council
Chart 6: Returns have been dominated by the East, volatility by the West
20-minute intraday spot gold mid-price annualised return volatility divided into regional trading sessions*
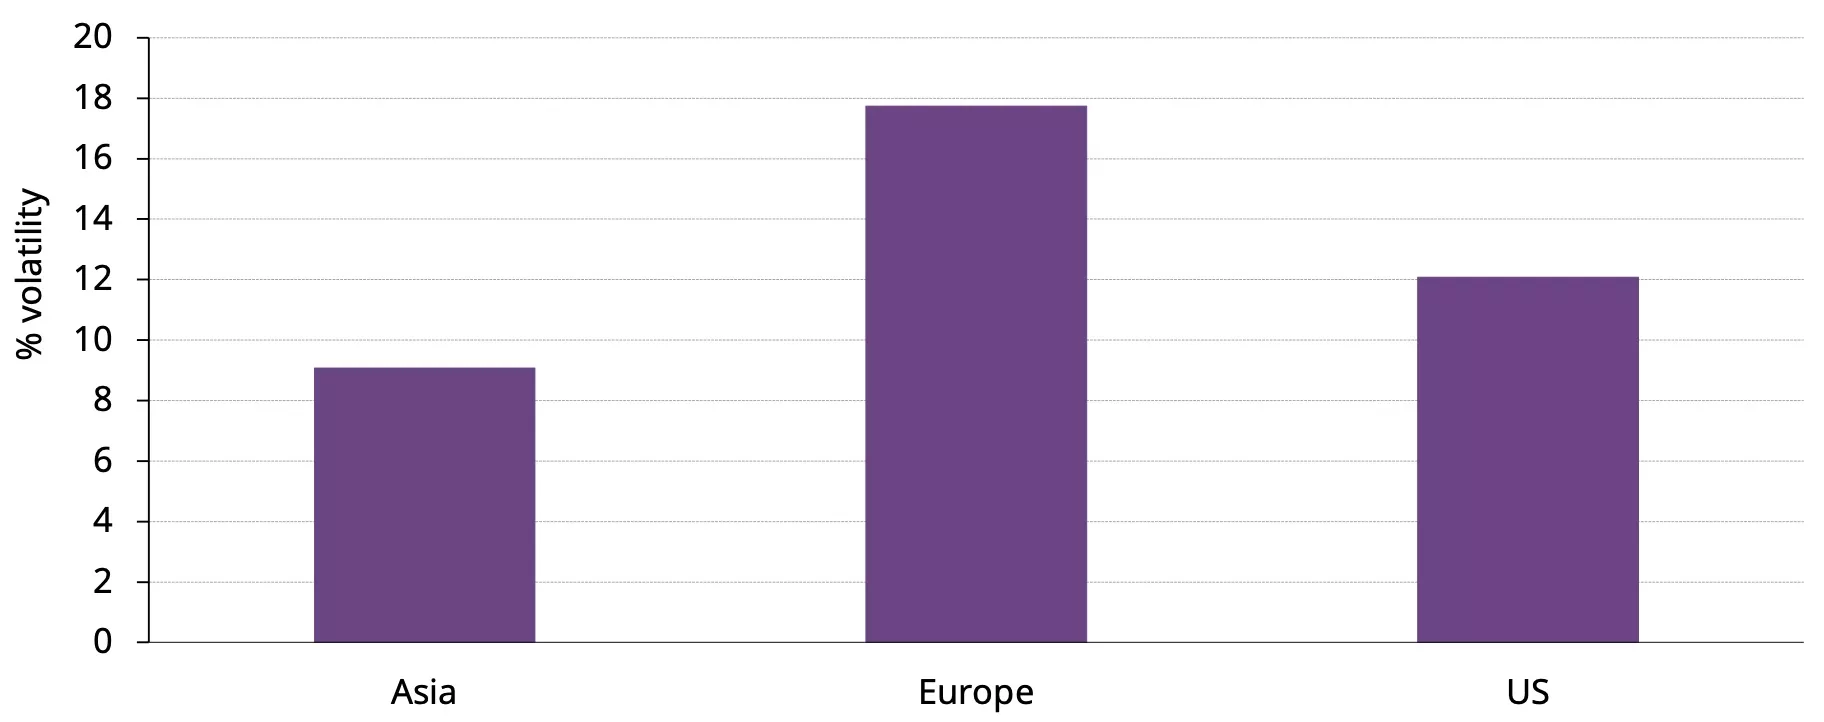
*Data from 1 January 2024 to 31 October 2024. Volatility is calculated as the annualised volatility of 20-min log returns per session. Sessions: Asia 2200 to 1100 UTC, Europe: 1100 to 1400 UTC, US: 1400 to 2200. Asia session runs from 22:00 UTC to 1100 UTC, overlapping with normal European trading hours, given that much of larger Asia gold trade is likely to take place at the LBMA AM benchmark price at 1100 UTC. Asian trading hours remain the largest contributor, albeit to a lesser extent if we end the session at 0700 UTC.
Source: Factset, World Gold Council
The big little rally
If we look back before 2024 to where the current rally began, while impressive, it ranks quite poorly compared to historical bull runs – having been both lower in magnitude and duration than all except the rally of 1983 (Chart 7). This stands to reason given the reluctance of many Western investors to join the fray; some perhaps having misjudged the reasons for the rally and others fearing they have missed it altogether.
Chart 7: The rally is impressive but ranks low compared to previous run-ups
Gold price and bull market rallies since 1971*
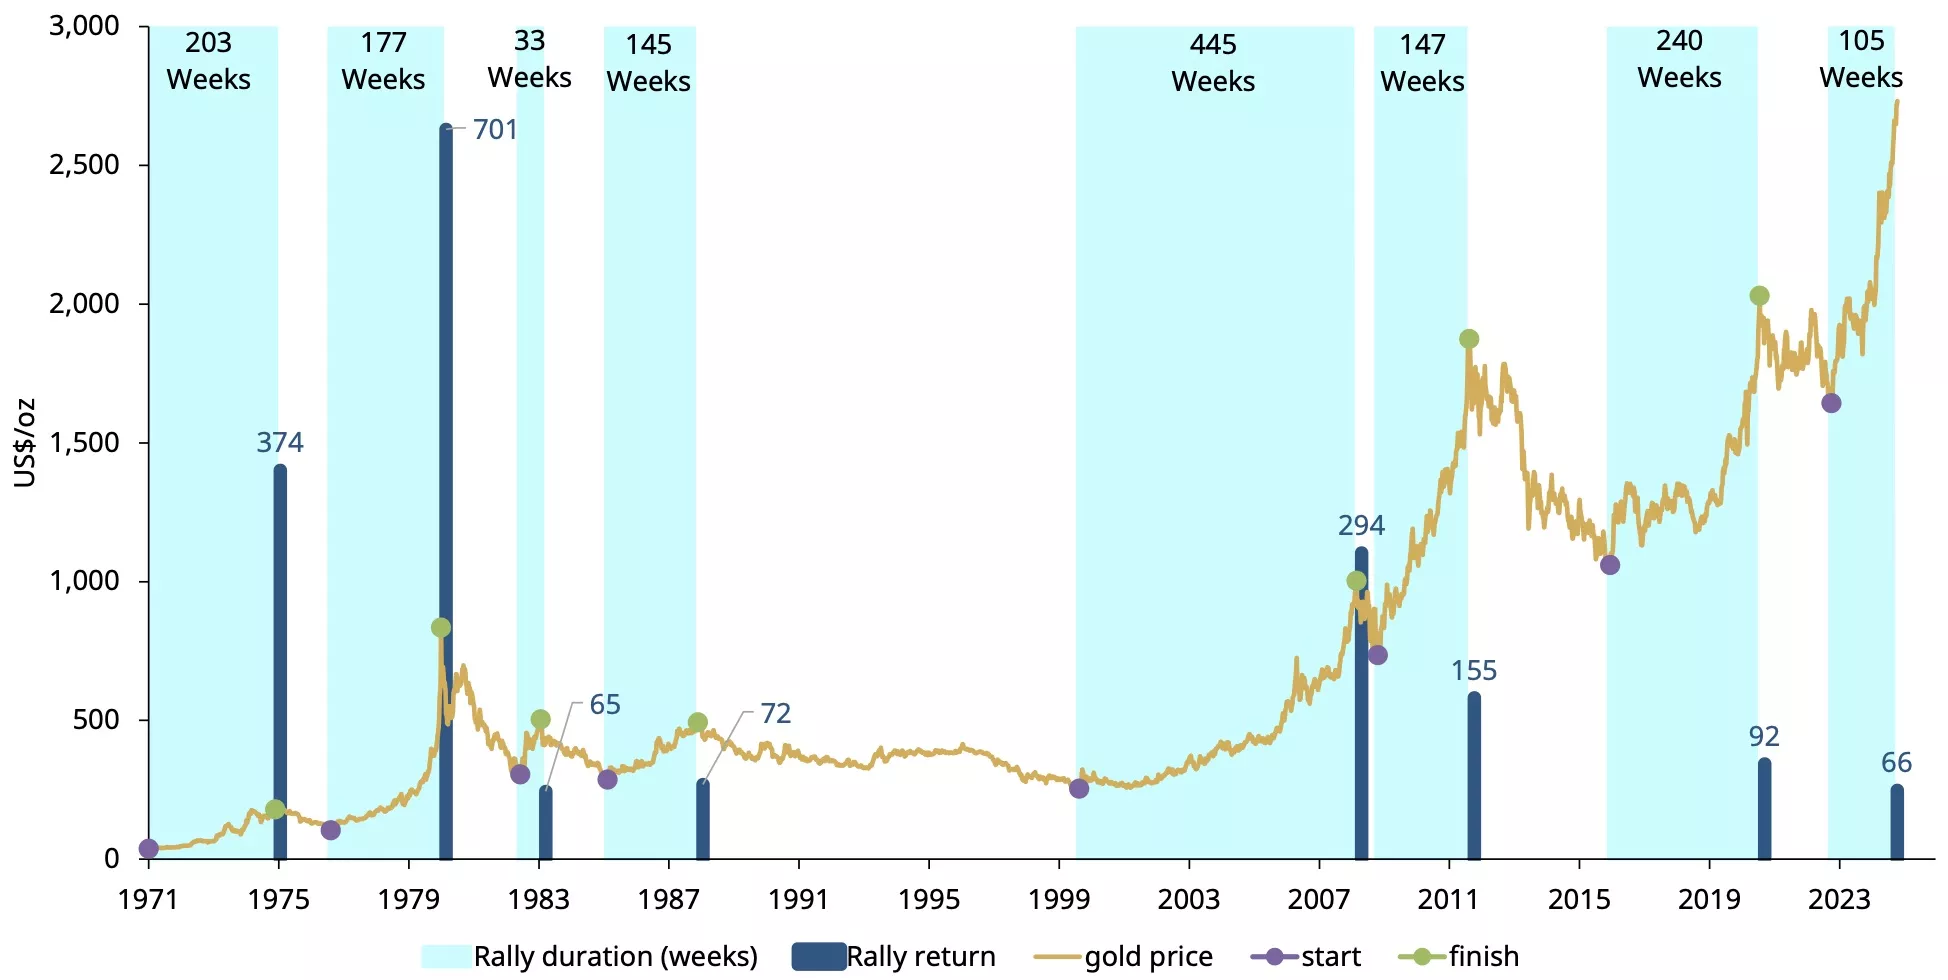
*Data from 31 December 1971 to 31 October 2024. Bull market start and end points defined using SciPy ‘argrelextrema’ package on a smoothed price series with conditions of minim run duration of 26 weeks and return of 20%, followed by a minimum 20% pullback prior to next local minimum.
Source: Source: Bloomberg, World Gold Council
In summary
It has been a strong run for gold in 2024, dominated by Asian hours trading. Central banks, emerging market bar and coin as well as other investors have been instrumental in driving up prices even in the face of strong US Treasury yields, a firm US dollar and hitherto reluctant Western investors. But it’s worth noting that:
- The run ranks low in relation to previous rallies
- Media coverage and Western investor participation has been lower than during 2020, for example, when gold breached new highs for the first time in over a decade, suggesting sentiment isn’t overly stretched
- Futures markets net long exposure is extended, but is a considerably weaker forward indicator for gold price trajectories than extended net shorts
- The conditions remain for demand to continue to impress including elevated geopolitical risk, overvalued equity markets, low Western investor gold ownership and central bank buying.
