China’s gold market update: Investment robust in February
13 March, 2025
Highlights
- Gold’s strength sustained: during the period from 27 January to 28 February 2025 – taking account of the Chinese New Year’s (CNY) holiday1 – the LBMA Gold Price PM was up by 3.4% and the Shanghai Benchmark Gold Price PM (SHAUPM) rose by 4.3%2
- The local gold price spread dipped in February as wholesale gold demand fell seasonally: gold withdrawals from the Shanghai Gold Exchange (SGE) dropped 27% m/m to 90t. And the y/y weakness continued as tepid gold jewellery sales, in tonnage terms, overshadowed robust investment
- Chinese gold ETFs witnessed their strongest monthly inflow on record, adding RMB14bn (US$1.9bn) in February and lifting the total assets under management (AUM) to RMB89bn (US$12bn). Holdings surged by 21t to 131t and both the AUM and holdings reached month-end peaks
- The People’s Bank of China (PBoC) continued to announce gold purchases in the month, adding 5t to its gold holdings. Four consecutive monthly purchases have pushed China’s gold reserves to 2,290t, 5.9% of total.
Looking ahead
- In the near future we believe that investment demand for gold will likely stay robust – despite potential fluctuations as the gold price changes – and gold jewellery consumption may start to stabilise should the local gold price remain steady and the economic picture continue to improve.
Chart 1: The RMB gold price held strong in February
Annual returns of the SHAUPM in RMB and the LBMA Gold Price PM in USD*
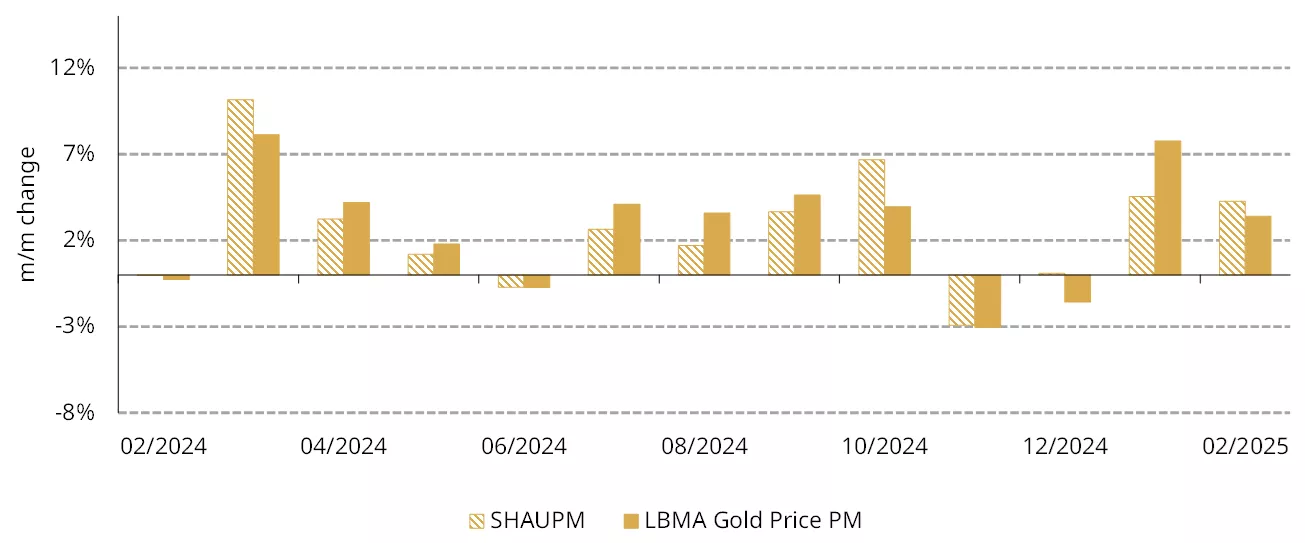
*February return based on prices between 27 January – the last trading day before the CNY holiday – and 28 February 2025.
Source: Bloomberg, World Gold Council
Gold price strength extends
Gold prices rose further. Both the SHAUPM in RMB and the LBMA Gold Price PM in USD climbed higher between 27 January and 28 February as noted above (Chart 1). The relative outperformance of the gold price in RMB, compared to its USD peer, was mainly driven by a 0.5% depreciation in the local currency during the period.
Although gold prices adjusted lower in the latter half of February, they continued to refresh records during the period, both in USD (on 11 occasions) and RMB (on six occasions). Our analysis shows that market momentum, generally lowering yields and a weaker dollar drove gold higher.
Wholesale demand falls seasonally
Gold withdrawals from the SGE declined in February, totalling 90t, a 28% m/m drop. This weakness is mainly seasonal – wholesalers and manufacturers typically buy less gold after the CNY holiday due to active replenishment prior. In fact, every February on record – except 2023 when pent-up demand from COVID restrictions pushed up demand – has seen a m/m decline, averaging 41% over the past ten years. Lower demand during the month led to a fall in the Shanghai–London gold price spread (Chart 2).
Chart 2: Wholesale demand fell seasonally in February
Gold withdrawals from the SGE and the Shanghai-London gold price spread*
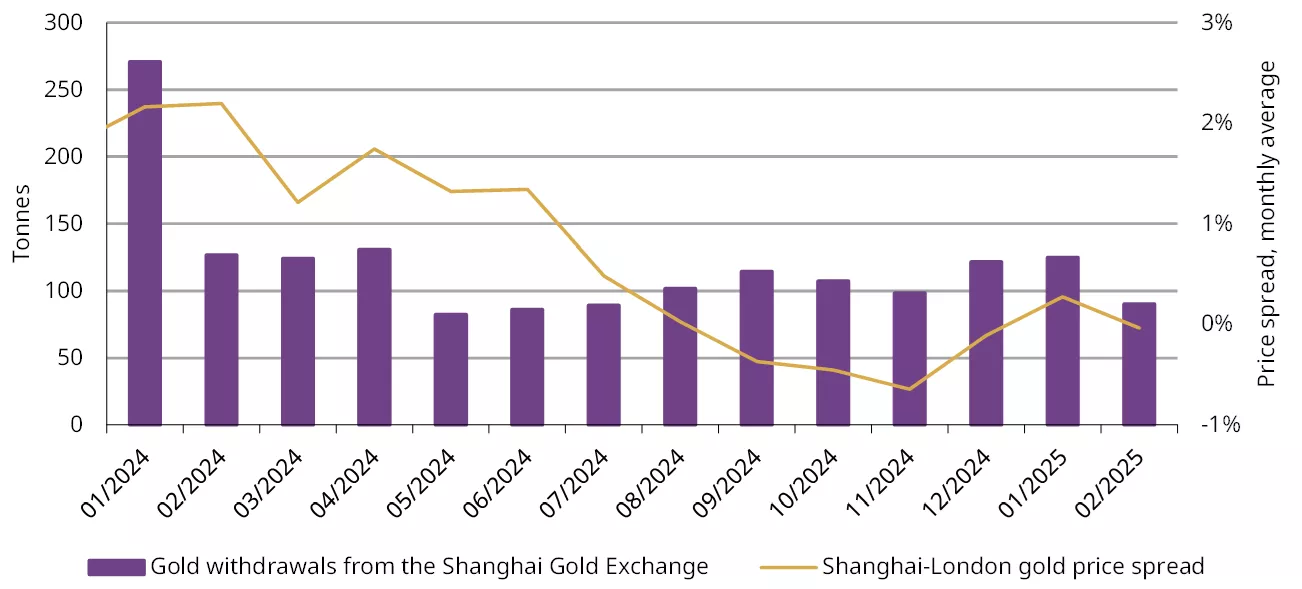
*As of 28 February 2025.
Source: Shanghai Gold Exchange, World Gold Council
But the y/y picture remains weak. As previously noted, the soaring local gold price continues to supress local gold jewellery demand in tonnage terms, leading to weaker stocking activities among jewellery manufacturers, who account for the lion’s share of SGE withdrawals. In contrast, investment demand for gold has been robust as the soaring gold price attracts investors. But it was not enough to offset the jewellery sector weakness, resulting in a 29% y/y fall in February’s total withdrawals (Chart 3).
Chart 3: February wholesale demand remained weak compared to previous years
Gold withdrawals from the SGE and the 10-year average*
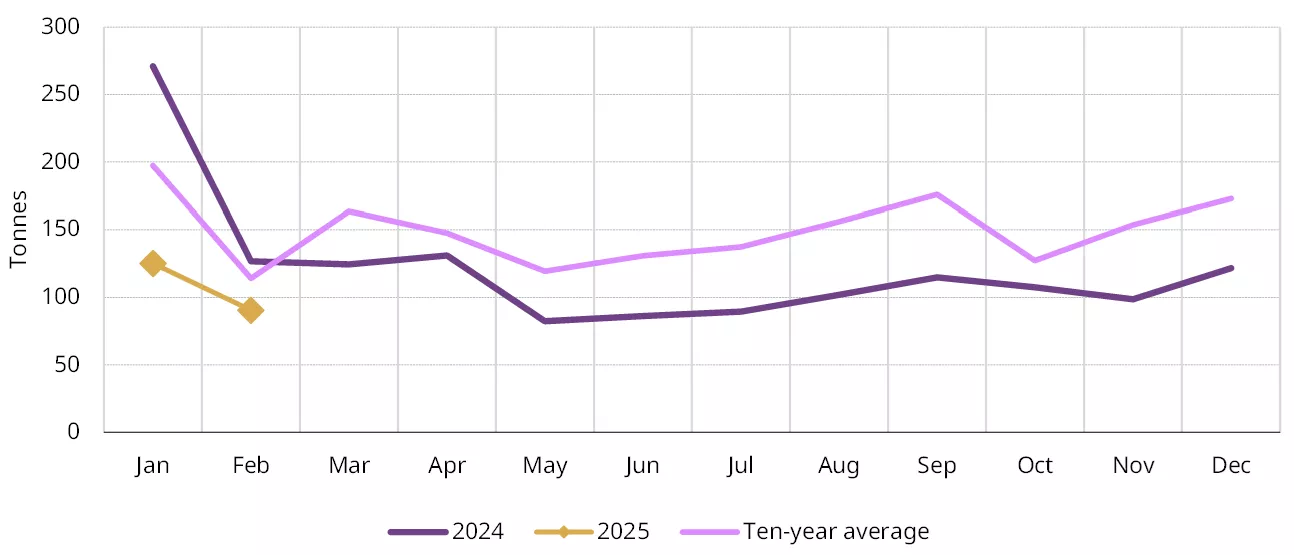
*The 10-year average is based on data between 2015 and 2024.
Source: Shanghai Gold Exchange, World Gold Council
Chinese gold ETFs see record-level inflows
Chinese gold ETFs added RMB14bn (US$1.9bn) in February, the largest ever monthly inflow. Sizable inflows and a rising gold price pushed Chinese gold ETFs’ total AUM to RMB89bn (US$12bn), another month-end peak (Chart 4). Meanwhile, holdings rose 21t to 131t, also the highest on record. The strong local gold price performance in the month – especially the gapping up at opening on 5 February when investors came back from the CNY holiday – attracted attention. Meanwhile, concerns around the Trump administration’s trade policy may have sparked some safe-haven flows.
Chart 4: Both Chinese gold ETFs’ AUM and holdings reached record highs
Collective holdings and AUM of Chinese gold ETFs*
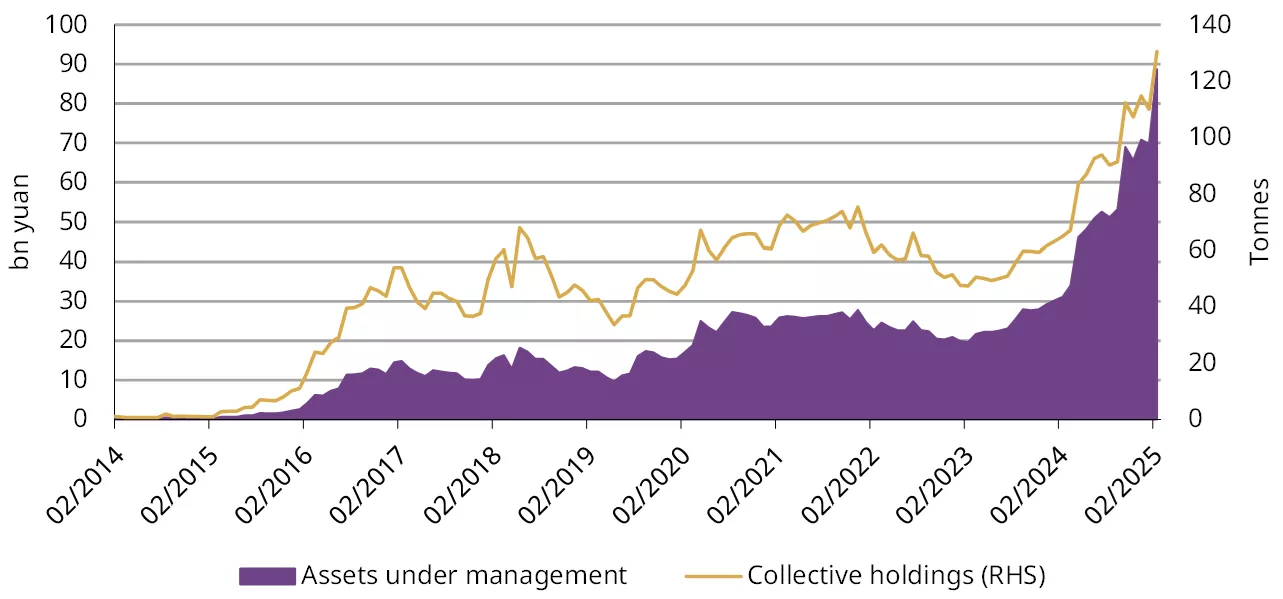
*As of 28 February 2025.
Source: Company filings, World Gold Council
Official gold holdings’ rising streak extends to four months
The PBoC reported another 5t gold purchase in February, the fourth consecutive month of gold reserve increases (Chart 5). At the end of February China’s official gold holdings stood at 2,290t, the highest on record, accounting for 5.9% of total foreign exchange reserves. During the first two months of 2025 Chinese gold reserves increased by 10t in total.
Chart 5: The PBoC adds gold four months in a row
Reported official gold holdings and gold as a percentage of total foreign exchange reserves*
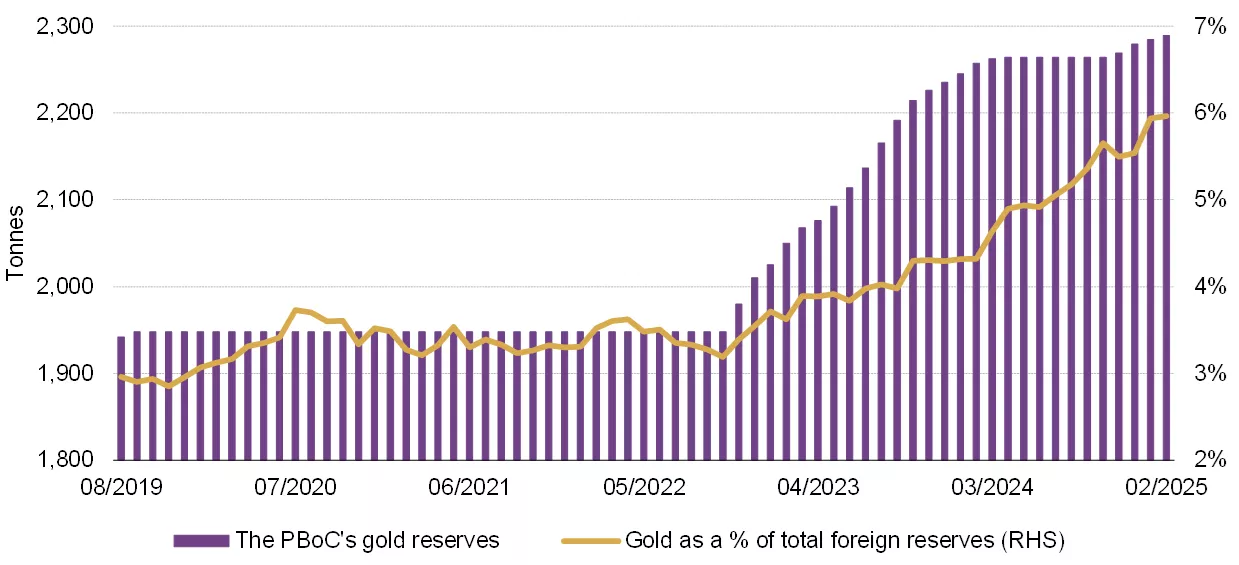
*As of 28 February 2025.
Source: State Administration of Foreign Exchange, World Gold Council
Looking ahead
China’s economic growth is showing signs of improvement. Official manufacturing and composite PMIs both exceeded the market consensus, expanding in February. And new loans during January surged to a record high, far outpacing expectations – also reflecting policy stimulus to shore up credit and bank loans front-loading patterns. More importantly, January also saw a tick up in consumer confidence – although the sustainability of this improvement needs to be monitored closely (Chart 6). Meanwhile, the “two sessions” revealed an official growth target of 5% for 2025, together with stronger fiscal and monetary policy supports, including a higher deficit-to-GDP ratio of 4% and further interest rate cuts to achieve this goal.3
Chart 6: Economic activities improved after the CNY holiday and consumer confidence ticked up
The official PMIs (above)* and consumer confidence and expectation of future income (below)**
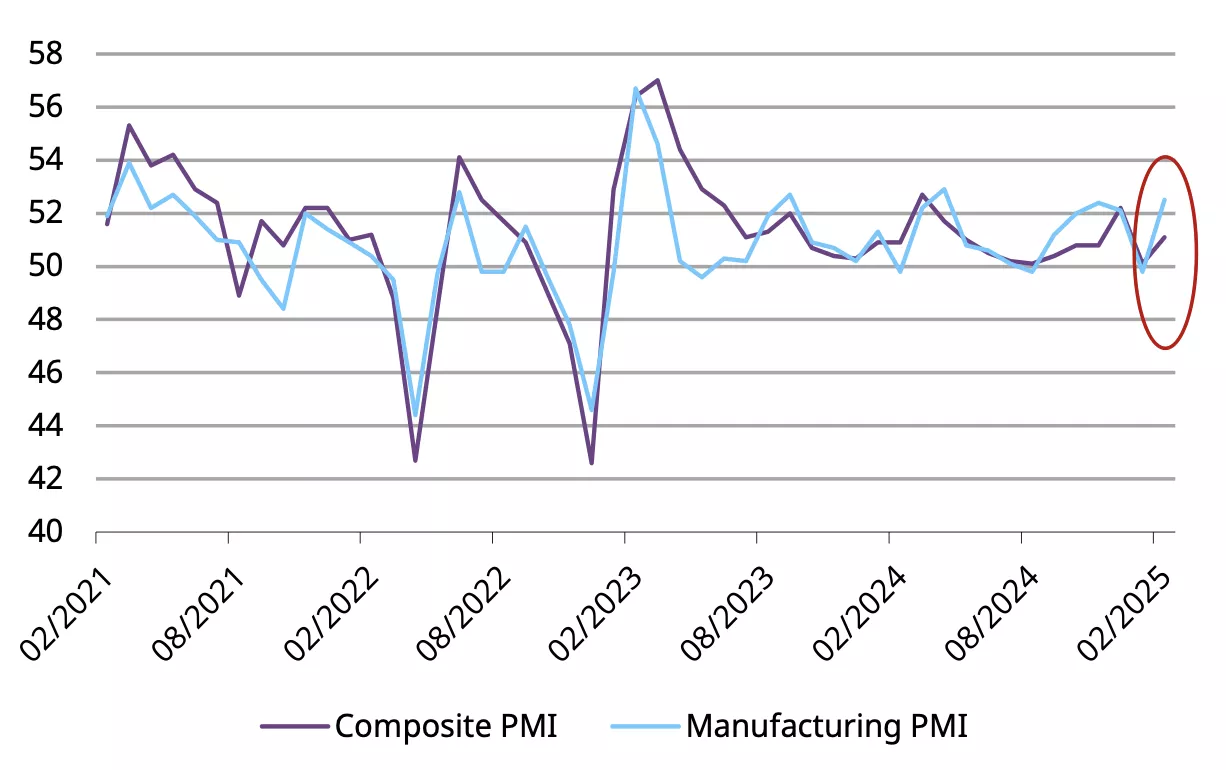
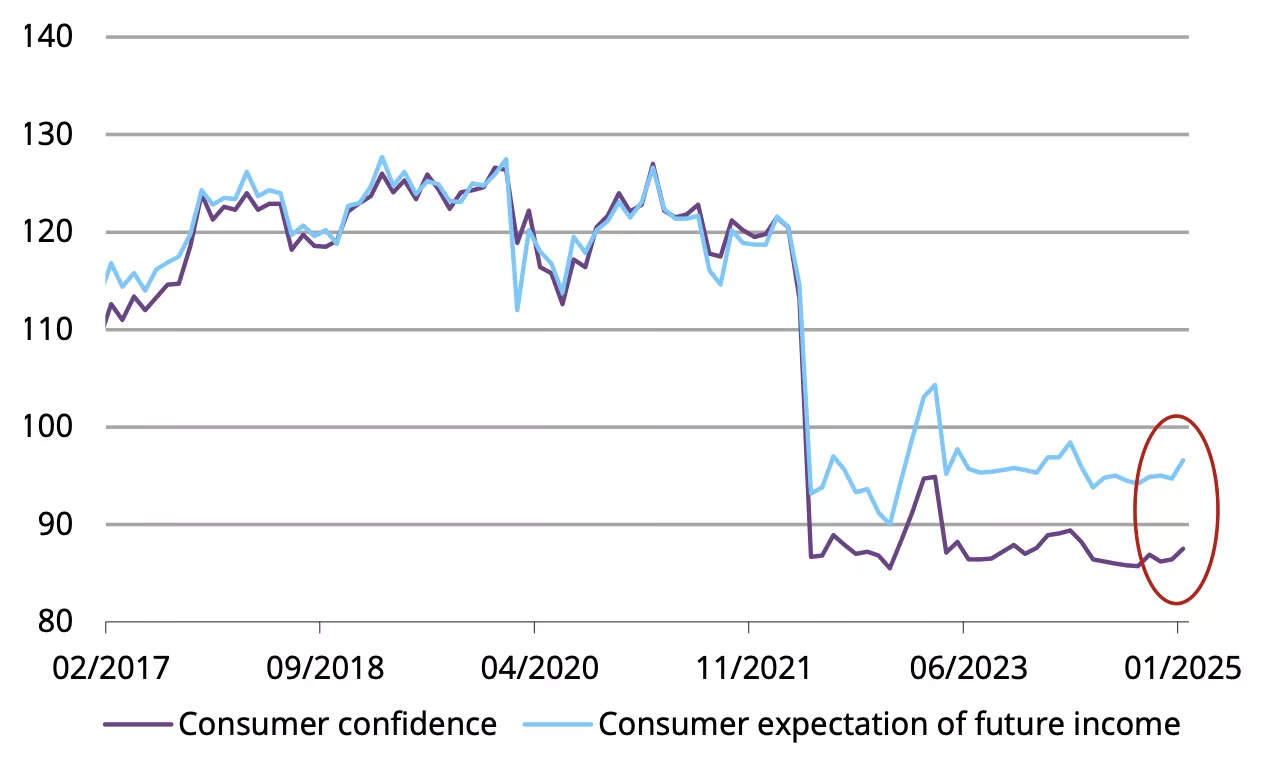
*As of February 2025.
**As of January 2025.
Source: Bloomberg, World Gold Council
Should the gold price continue to stabilise and economic prospects keep improving, stability should return to the gold jewellery sector. We continue to believe that investment demand for gold could also remain generally robust as investors anticipate further price gains and concerns of the US trade policy uncertainties push up safe-haven buying.
Footnotes
1The CNY holiday occurred between 28 January and 4 February 2025 and local markets were closed.
2We refer to the LBMA Gold Price PM here as this is the standard global gold price benchmark; we use LBMA Gold Price AM and SHAUPM to compute Shanghai-London gold price spread as they have a narrower trading window.
3For more, see: Targets set in 2025 government work report, 5 March 2025.
Disclaimer
Important information and disclaimers
© 2025 World Gold Council. All rights reserved. World Gold Council and the Circle device are trademarks of the World Gold Council or its affiliates.
All references to LBMA Gold Price are used with the permission of ICE Benchmark Administration Limited and have been provided for informational purposes only. ICE Benchmark Administration Limited accepts no liability or responsibility for the accuracy of the prices or the underlying product to which the prices may be referenced. Other content is the intellectual property of the respective third party and all rights are reserved to them.
Reproduction or redistribution of any of this information is expressly prohibited without the prior written consent of World Gold Council or the appropriate copyright owners, except as specifically provided below. Information and statistics are copyright © and/or other intellectual property of the World Gold Council or its affiliates or third-party providers identified herein. All rights of the respective owners are reserved.
The use of the statistics in this information is permitted for the purposes of review and commentary (including media commentary) in line with fair industry practice, subject to the following two pre-conditions: (i) only limited extracts of data or analysis be used; and (ii) any and all use of these statistics is accompanied by a citation to World Gold Council and, where appropriate, to Metals Focus or other identified copyright owners as their source. World Gold Council is affiliated with Metals Focus.
The World Gold Council and its affiliates do not guarantee the accuracy or completeness of any information nor accept responsibility for any losses or damages arising directly or indirectly from the use of this information.
This information is for educational purposes only and by receiving this information, you agree with its intended purpose. Nothing contained herein is intended to constitute a recommendation, investment advice, or offer for the purchase or sale of gold, any gold-related products or services or any other products, services, securities or financial instruments (collectively, “Services”). This information does not take into account any investment objectives, financial situation or particular needs of any particular person.
Diversification does not guarantee any investment returns and does not eliminate the risk of loss. Past performance is not necessarily indicative of future results. The resulting performance of any investment outcomes that can be generated through allocation to gold are hypothetical in nature, may not reflect actual investment results and are not guarantees of future results. The World Gold Council and its affiliates do not guarantee or warranty any calculations and models used in any hypothetical portfolios or any outcomes resulting from any such use. Investors should discuss their individual circumstances with their appropriate investment professionals before making any decision regarding any Services or investments.
This information may contain forward-looking statements, such as statements which use the words “believes”, “expects”, “may”, or “suggests”, or similar terminology, which are based on current expectations and are subject to change. Forward-looking statements involve a number of risks and uncertainties. There can be no assurance that any forward-looking statements will be achieved. World Gold Council and its affiliates assume no responsibility for updating any forward-looking statements.
Information regarding QaurumSM and the Gold Valuation Framework
Note that the resulting performance of various investment outcomes that can be generated through use of Qaurum, the Gold Valuation Framework and other information are hypothetical in nature, may not reflect actual investment results and are not guarantees of future results. Neither World Gold Council (including its affiliates) nor Oxford Economics provides any warranty or guarantee regarding the functionality of the tool, including without limitation any projections, estimates or calculations.
