India gold market update: Investment appetite upheld
19 March, 2025
Highlights
- Gold’s price momentum remains strong, breaching records, with domestic gold prices gaining 13% y-t-d
- Price rises dampen jewellery purchases but boost old gold sales; investment demand is sustained: gold ETFs see healthy inflows in February, although below January’s peak
- The Reserve Bank of India (RBI) gold holdings remains unchanged in February
- Gold imports drop to an 11-month low in February.
Looking ahead
- Expectation is growing that seasonal factors (auspicious days and festivals) and wedding related purchases could lend support to gold demand over the next couple of months. This may not, however, fully compensate for the price-driven constraints in jewellery demand.
Gold’s unprecedented momentum
Gold’s momentum has been exceptionally strong in 2025. So far this year prices have hit 13 new highs1 and have crossed the psychological threshold of US$3,000/oz.2 This performance, which has been replicated across major currencies, is driven by economic trends and sustained investment demand. Geopolitical and economic uncertainty, a weaker USD, lowering of interest rates across economies, and inflation concerns are fuelling investment demand and influencing prices.
Chart 1: Gold’s unyielding rise
Monthly LBMA Price AM and domestic landed price changes and movement*
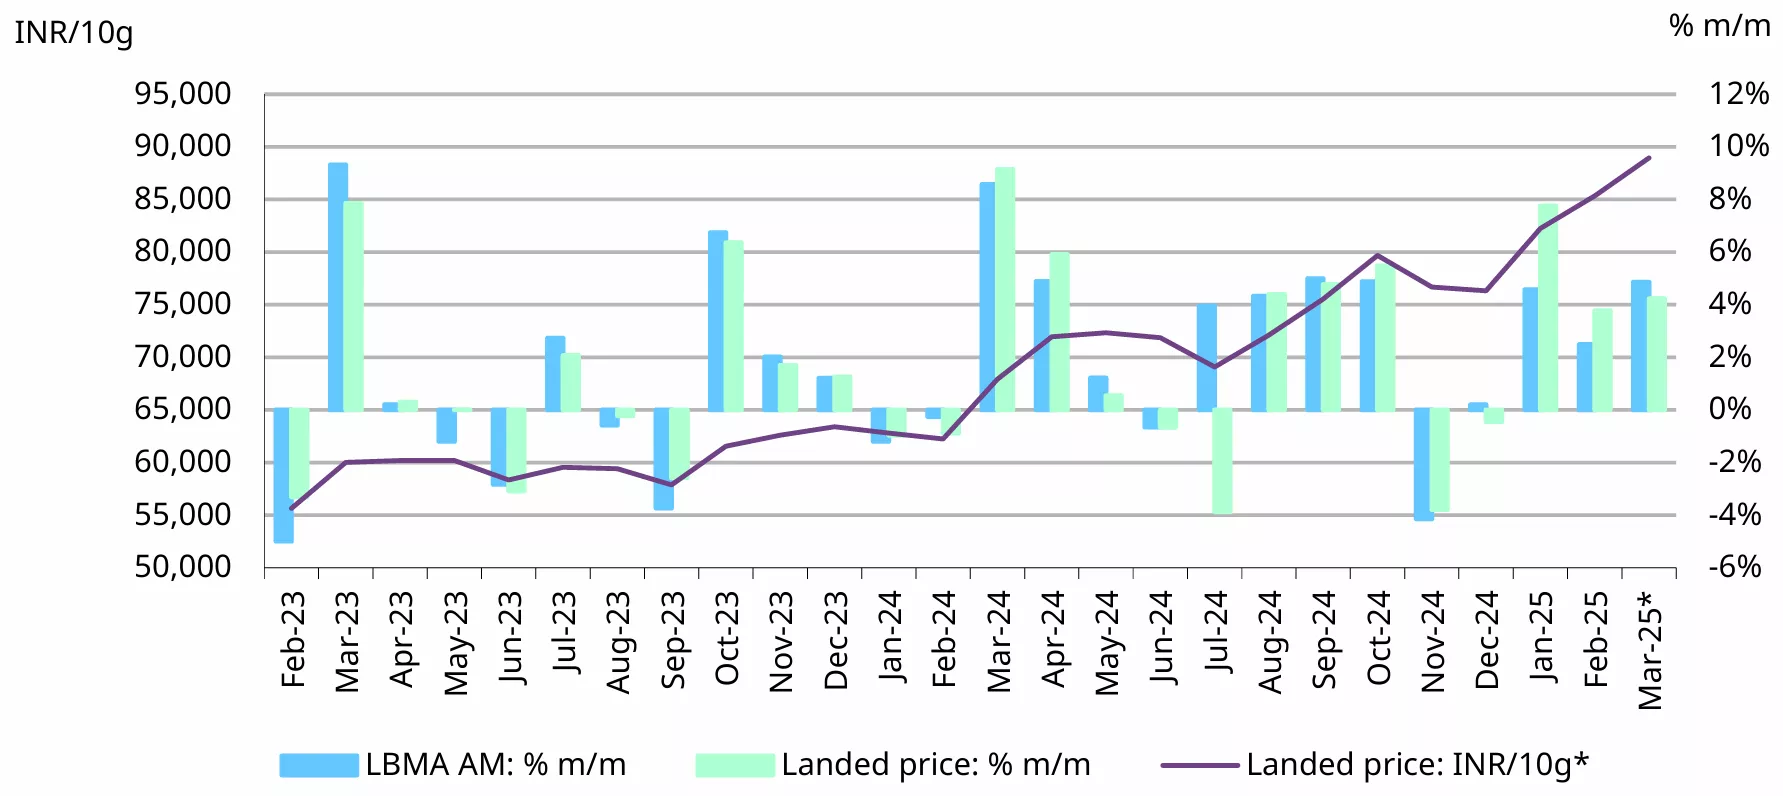
*Based on the LBMA Gold Price AM in USD expressed in local currency as of 14 March 2025. Landed price of gold is the international price (LBMA gold price AM) adjusted for import taxes and exchange rate
Source: Bloomberg, World Gold Council.
So far in 2025,3 the LBMA gold price AM in USD has risen by US$330/oz or 12%, to US$2,999/oz, with over 4% of that increase taking place in the first half of March. The Indian domestic landed price4 has risen in tandem, gaining 17% to reach a record INR88,946/10g. The larger gains can be attributed to weakness in the INR against the USD (1.3% depreciation y-t-d). However, given the weakness in demand – particularly in jewellery – the domestic gold price remains at a discount relative to the landed price. The discount, or spread, between local and landed prices averaged US$12/oz in the first half of March, slightly narrower than the US$17/oz spread observed in February.
Gold remains India’s top performing asset, with y-t-d gains of 13%,5 in sharp contrast with the negative return from domestic equities and notably surpassing gains in fixed income assets (bonds and bank deposits). This underscores the strategic significance of gold in investor portfolios.
Chart 2: Gold outperforms other asset classes
% y-t-d returns in INR*
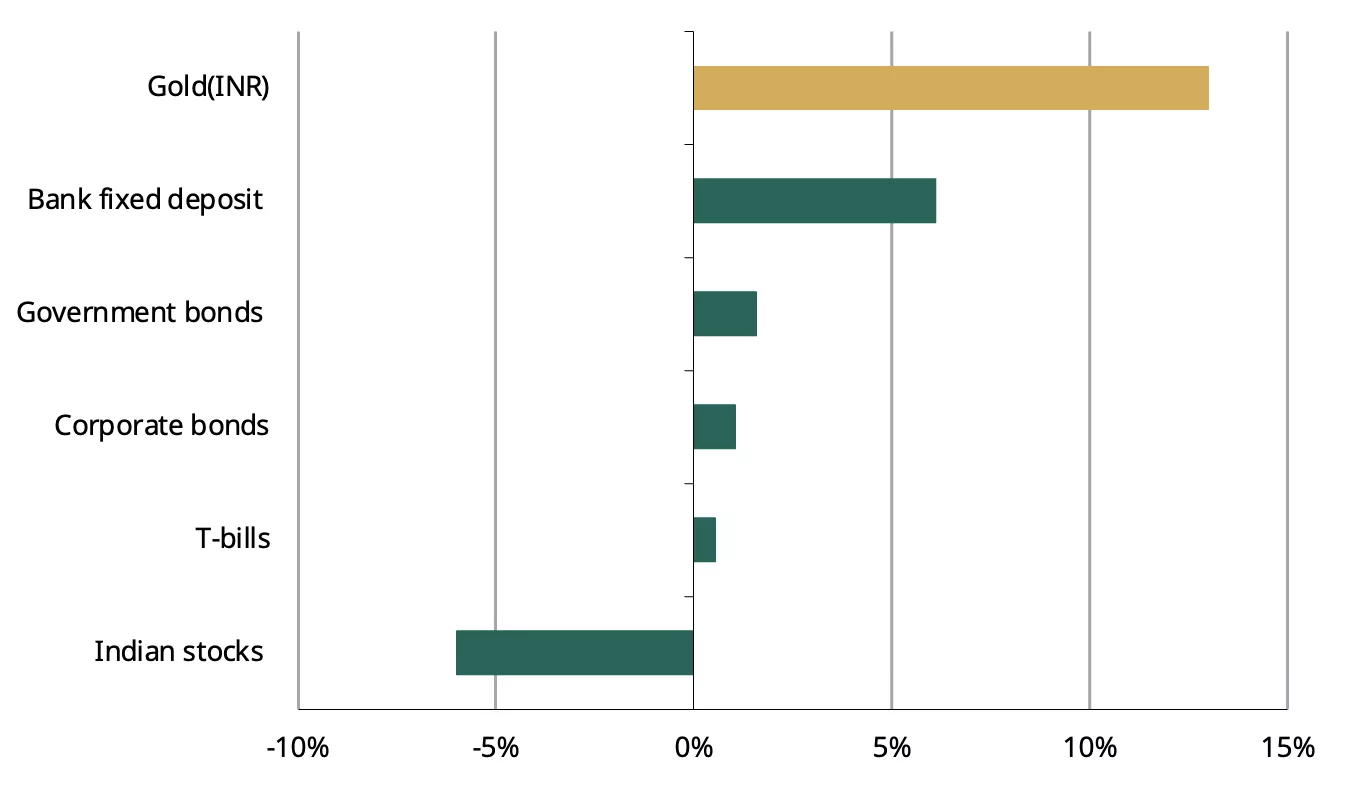
*As of 13 March 2025. Indices used: MCX Gold Index (for 995 purity), CRISIL Corporate Bond Index, S&P BSE Sensex Total Return Index, Clearing Corp of India Liquidity Weight T-Bill Index, ICE BofA Govt Bond Index.
Source: Bloomberg, World Gold Council
Price surge limits jewellery purchases but drives sales of old gold
Record high prices have dented demand, particularly for gold jewellery, with purchases restricted to those that are need-based, primarily weddings. In addition, financial year-end dynamics, such as statutory payments and tax-saving investments, are curtailing discretionary spending and further weighing on demand. This slowdown is broad-based across both urban and rural areas. Anecdotal reports indicate that consumers continue to wait on the sidelines, hoping for a correction in prices or at least signs of price stability. Despite this, notwithstanding an easing in momentum, investment demand for bars and coins remains relatively healthy, driven by bullish sentiment regarding the future trajectory of the gold price.
The surge in gold prices has prompted sales of old gold jewellery. Retailers have reported a significant uptick in scrap or old gold sales, with some attributing up to a third of their sales to the exchange of old jewellery for newer, lighter pieces. Furthermore, loans against gold jewellery have increased. To the end of January this year, retail gold loans by commercial banks were up 77% y/y, indicating that consumers are increasingly leveraging gold for liquidity and financial gain.
Gold ETFs maintain momentum
Indian gold ETFs continued their inflow in February. While lower than January’s record high, they remained healthy, driven by broadening investor interest amid global economic and market uncertainty and the positive momentum in the gold price.
According to the Association of Mutual Funds in India (AMFI), gold ETFs recorded net inflows of INR19.8bn(~US$227mn) in February,6 marking the tenth consecutive month of positive flows. Although lower than January’s peak,7 this surpassed the average net inflow figure (INR14.8bn/US$175mn) recorded over the preceding nine months. February also witnessed significant redemptions, totalling INR7.8bn/US$89.7mn – the highest since April 2024. This may be attributed to profit taking as gold prices surged. Despite these redemptions, investor participation remained strong with 0.3mn investor accounts (or folios) added during the month, bringing the total number of gold ETF investor accounts to a record 6.8mn, reflecting a growing investor interest in this instrument. Cumulative assets under management (AUM) of gold ETFs grew to INR55.7bn(~US$6.4bn), up 7% m/m and 95% y/y. Overall holdings increased by 2.2t, taking collective holdings to 64.6t. These figures are in line with our initial estimates based on information available at the time.8 Rising investor interest has encouraged fund houses to introduce new gold ETF products, two of which were launched in February, bringing the total number of domestic gold ETFs to 20. At the end of February gold ETFs accounted for 0.9% of total AUM of mutual funds, up from 0.5% a year ago – an indication of the growing traction among investors.
Chart 3: Gold ETFs keep climbing
Monthly gold ETF fund flows in INRbn, and total holdings in tonnes*
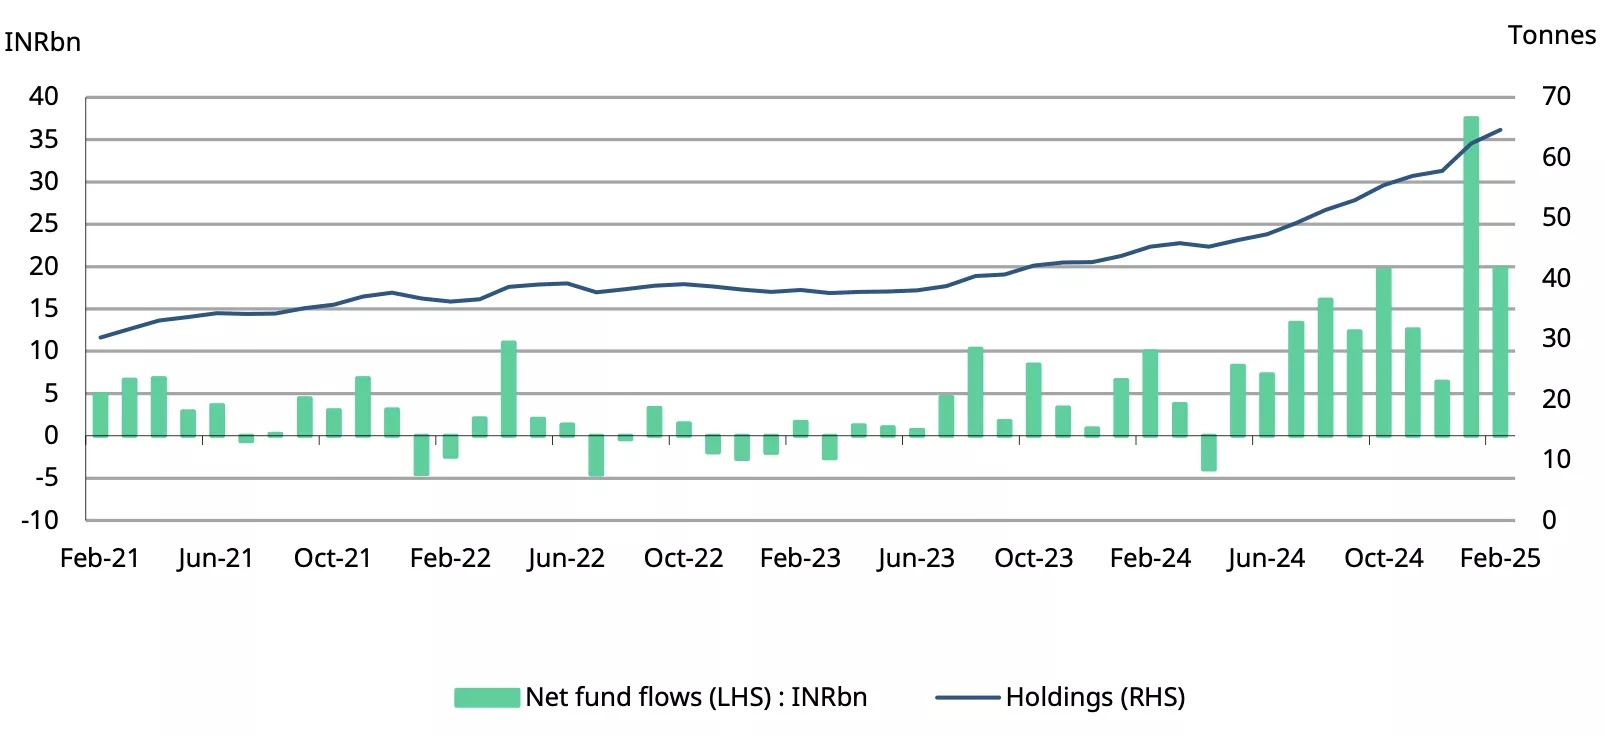
*As of end February 2025.
Source: AMFI, ICRA Analytics, CMIE, World Gold Council
RBI gold reserves stable, share of gold in forex reserves rising
The RBI held off buying gold in February, marking its second pause in three months, according to our estimates based on the bank’s weekly reporting of forex reserves. However, the bank has been increasing its gold holdings consistently since the beginning of 2024, purchasing an average of 6.3t in 12 of the last 14 months. While its gold reserves remained steady at 879t in February, the share of gold in total forex reserves rose to 11.5%,9 the highest on record and almost 4% higher than a year ago. This highlights the RBI’s continued diversification of its forex reserves.
Chart 4: RBI’s gold buying pauses twice in three months
RRBI’s net purchases and reserves, in tonnes*
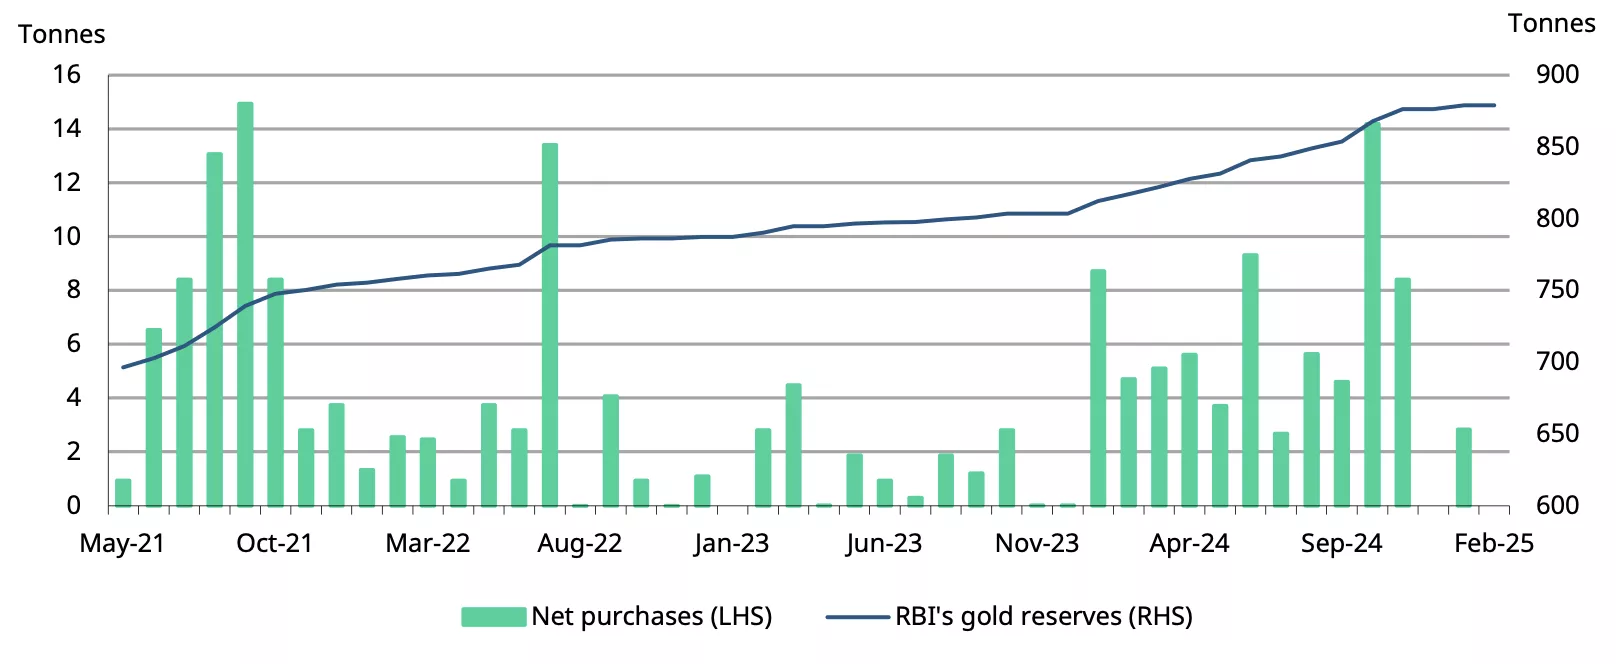
*Data as of 7 March 2025.
Source: RBI, World Gold Council
Gold imports decline further
February gold imports fell to their lowest level since March 2024, marking the third consecutive month of decline and a steep drop from November's highs. This trend reflects the weak demand environment amid high prices. According to Ministry of Commerce data10 the gold import bill for February totalled $2.3bn – a 14% m/m and 63% y/y decline. We estimate that import volume in February ranged between 25t and 30t.
Chart 5: Downtrend in gold imports
Monthly gold imports in tonnes and US$bn*
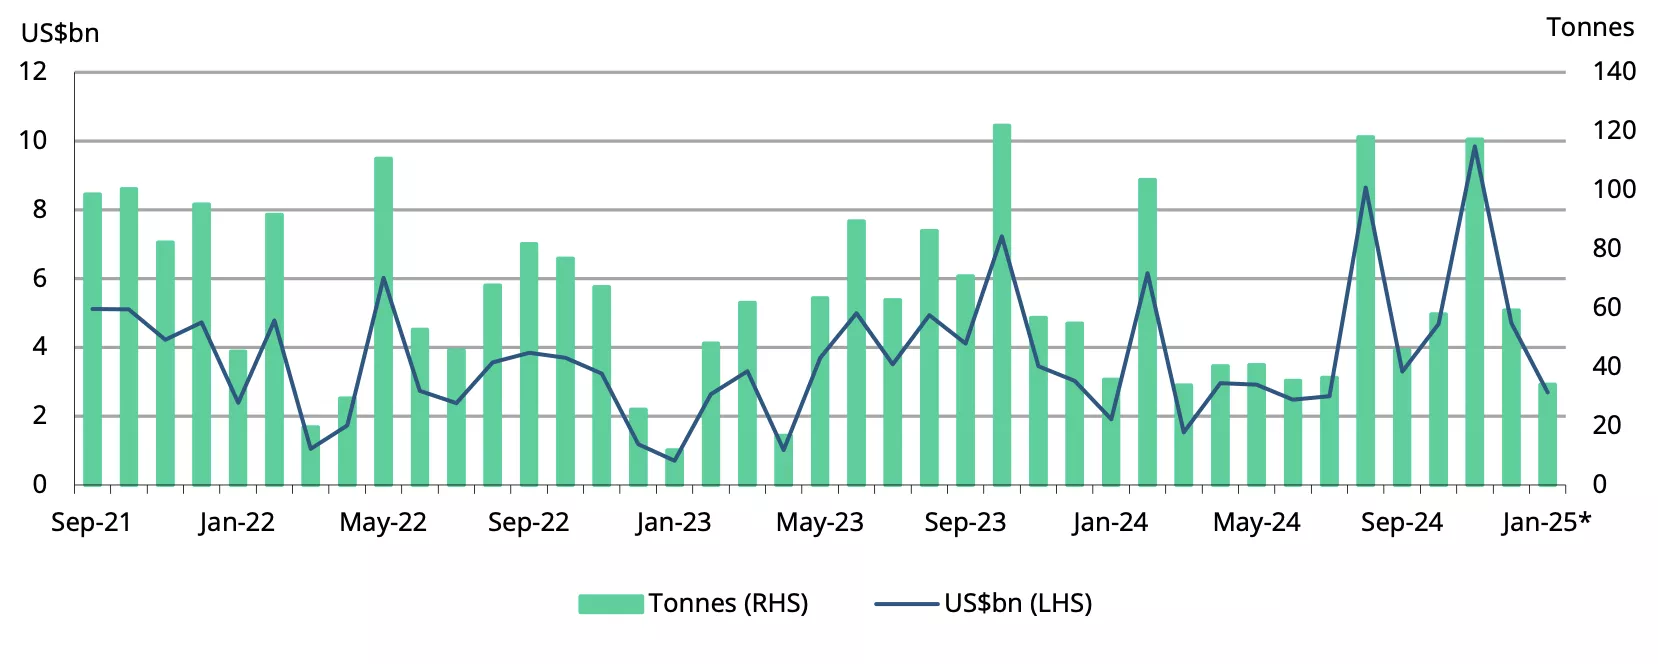
*Includes World Gold Council estimates.
Source: Ministry of Commerce and Industry, CMIE, World Gold Council
Footnotes
1As of 14 March 2025.
2In the spot market on 14 and 17 March, 2025.
3As of 14 March 2025.
4Landed price of gold is the international price (LBMA gold price AM of 999 purity) adjusted for import taxes and exchange rate.
5The gold price is the MCX gold spot price for 995 purity.
6Our initial estimate based on partial information was US$220mn.
7Indian gold ETF inflows in January 2025 were INR 37.5bn/US$435mn.
8The daily AUM and NAV data published by AMFI covers 16 of the country’s 20 gold ETFs.
9As of end February 2025.
10Press release by the Ministry of Commerce on foreign trade, 17 March, 2025.
Disclaimer
Important information and disclaimers
© 2025 World Gold Council. All rights reserved. World Gold Council and the Circle device are trademarks of the World Gold Council or its affiliates.
All references to LBMA Gold Price are used with the permission of ICE Benchmark Administration Limited and have been provided for informational purposes only. ICE Benchmark Administration Limited accepts no liability or responsibility for the accuracy of the prices or the underlying product to which the prices may be referenced. Other content is the intellectual property of the respective third party and all rights are reserved to them.
Reproduction or redistribution of any of this information is expressly prohibited without the prior written consent of World Gold Council or the appropriate copyright owners, except as specifically provided below. Information and statistics are copyright © and/or other intellectual property of the World Gold Council or its affiliates or third-party providers identified herein. All rights of the respective owners are reserved.
The use of the statistics in this information is permitted for the purposes of review and commentary (including media commentary) in line with fair industry practice, subject to the following two pre-conditions: (i) only limited extracts of data or analysis be used; and (ii) any and all use of these statistics is accompanied by a citation to World Gold Council and, where appropriate, to Metals Focus or other identified copyright owners as their source. World Gold Council is affiliated with Metals Focus.
The World Gold Council and its affiliates do not guarantee the accuracy or completeness of any information nor accept responsibility for any losses or damages arising directly or indirectly from the use of this information.
This information is for educational purposes only and by receiving this information, you agree with its intended purpose. Nothing contained herein is intended to constitute a recommendation, investment advice, or offer for the purchase or sale of gold, any gold-related products or services or any other products, services, securities or financial instruments (collectively, “Services”). This information does not take into account any investment objectives, financial situation or particular needs of any particular person.
Diversification does not guarantee any investment returns and does not eliminate the risk of loss. Past performance is not necessarily indicative of future results. The resulting performance of any investment outcomes that can be generated through allocation to gold are hypothetical in nature, may not reflect actual investment results and are not guarantees of future results. The World Gold Council and its affiliates do not guarantee or warranty any calculations and models used in any hypothetical portfolios or any outcomes resulting from any such use. Investors should discuss their individual circumstances with their appropriate investment professionals before making any decision regarding any Services or investments.
This information may contain forward-looking statements, such as statements which use the words “believes”, “expects”, “may”, or “suggests”, or similar terminology, which are based on current expectations and are subject to change. Forward-looking statements involve a number of risks and uncertainties. There can be no assurance that any forward-looking statements will be achieved. World Gold Council and its affiliates assume no responsibility for updating any forward-looking statements.
Information regarding QaurumSM and the Gold Valuation Framework
Note that the resulting performance of various investment outcomes that can be generated through use of Qaurum, the Gold Valuation Framework and other information are hypothetical in nature, may not reflect actual investment results and are not guarantees of future results. Neither World Gold Council (including its affiliates) nor Oxford Economics provides any warranty or guarantee regarding the functionality of the tool, including without limitation any projections, estimates or calculations.
