Key highlights:
- Both the LBMA Gold Price AM in USD and the Shanghai Gold Benchmark PM (SHAUPM) in RMB rebounded in July; but the latter saw a smaller gain due to a stronger RMB
- Gold withdrawals from the Shanghai Gold Exchange (SGE) amounted to 115t, 8% lower m/m and 28% lower y/y; pressure came from a record-level RMB gold price, weak economic growth and seasonality
- Tighter conditions may have driven the local gold price premium higher in July
- Chinese gold ETFs saw another mild inflow in July, attracting US$52mn (RMB368mn); total assets under management (AUM) reached US$3.2bn (RMB23bn) and holdings were 0.7t higher at 50.9t
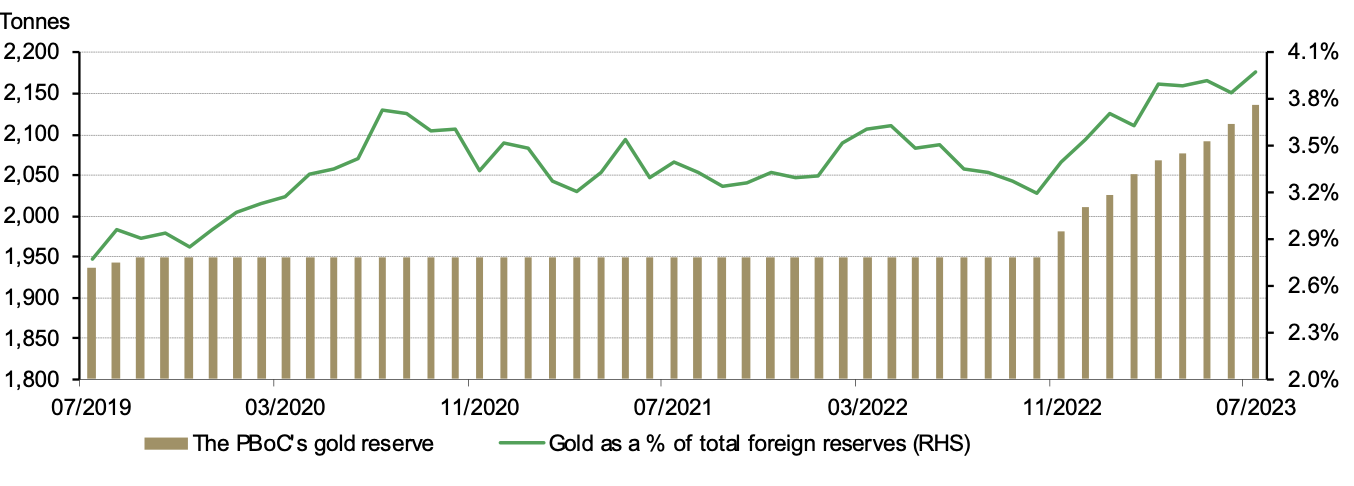
- The People’s Bank of China (PBoC) reported its ninth consecutive gold purchase in July, lifting its total gold reserves by 23t to 2,136t.
Looking ahead:
- Fully realising the challenges facing the local economy, policymakers released measures to stimulate domestic consumption in late July.1 And authorities are also planning accommodative policies for the real estate market.2 These efforts could improve China’s economic revival and potentially benefit gold consumption.
- Seasonality and the elevated gold price are likely to continue to weigh on local wholesale gold demand in the short-term. But September may see a round in demand amid various jewellery industry events and more active replenishment for the National Day Holiday, also the traditional wedding peak season, in early October
July’s average RMB gold price rose to the highest on record
Gold prices rebounded in July (Chart 1). The SHAUPM in RMB was up by 1.5% while the LBMA Gold Price AM in USD rose by 2.5%. The relative weakness in the SHAUPM was mainly due to appreciation in the RMB against the dollar.
The SHAUPM averaged RMB454/gram in July, continuing to break records. And during the first seven months of 2023, the SHAUPM delivered a return of just over 10%, outperforming major local assets.
Chart 1: The RMB gold price bounced higher in July
Wholesale demand weakened marginally in July
China’s economic recovery remained under pressure, despite scattered positive changes. While there was a mild improvement in the official manufacturing PMI, non-manufacturing PMIs contracted for the fourth consecutive month (Chart 2). Turning to demand, pent-up enthusiasm from the past three years pushed July’s domestic box office revenue to the highest ever. But the m/m decline in commercial real estate sales accelerated notably and auto sales remained weak.
Chart 2: Chinese PMIs showed mixed signs
The industry withdrew 115t of gold from the SGE in July, 10t lower m/m and a 46t y/y fall (Chart 3). A record-level RMB gold price and the still weak economic recovery weighed on local gold demand – borne out by anecdotal evidence from our regional market visits during the month. Seasonality was a further contributor to July’s wholesale demand weakness.
Chart 3: Gold withdrawals fell in July
Local premium saw a notable rebound
The Shanghai-London gold price spread in July surged, averaging US$17/oz, a US$11/oz jump from June (Chart 4). We have mentioned previously that changes in the local gold price premium are mainly determined by China’s gold supply and demand dynamics. With demand remaining tepid in July, we believe tighter supply conditions may have driven the premium higher.
Chart 4: The local gold price premium rebounded notably in July
The monthly average spread between SHAUPM and LBMA Gold Price AM in US$/oz*
Chinese gold ETF demand remained positive in July
Chinese gold ETFs saw continued inflows (US$52mn, RMB368mn), ending July with an AUM of US$3.2bn (RMB23bn). Holdings rose marginally by 0.7t to 50.9t. Overall, changes in ETF demand remained subtle, presumably investors are still at sidelines awaiting further signals of a clear gold price trend.
Chart 5: Chinese gold ETFs experienced another mild inflow in July
Monthly fund flows and Chinese gold ETF holdings
The PBoC announced another increase in its gold reserves
The PBoC reported another 23t rise in its gold reserves in July, lifting the total to 2,136t and marking the ninth consecutive monthly increase (Chart 6). Gold accounts for 4% of the country’s foreign exchange reserves, marginally higher than June’s 3.8%. During the past nine months, China announced a 188t addition to its gold reserves.
Chart 6: China’s gold reserves are rising
Imports fell in June, yet concluding H1 with a remarkable y/y rise
Gold imports totalled 98t in June, 50t lower than May. The m/m plunge may have been driven by a relatively low local gold price premium, which disincentivised importers, and the fact that Q2 is usually an off season for gold demand in China.
This brings China’s H1 gold imports to 792t, a significant pick up of 400t compared with H1 2022. The notable improvement in local gold consumption, as noted in our 2023 Q2 Gold Demand Trends, and the low base of H1 2022, when strict COVID-related controls were still in place, formed the basis of the recovery.
Chart 7: China’s H1 gold imports jumped during the first post-COVID year


