China’s gold market in September: demand rebounds seasonally, further strength may lie ahead
16 October, 2024
Key highlights:
- Gold kept surging: the LBMA Gold Price AM in USD and the Shanghai Gold Benchmark PM (SHAUPM) in RMB rose by 5.0% and 3.7% respectively in September, both ending Q3 with sizable gains
- The industry withdrew 118t gold from the Shanghai Gold Exchange (SGE) during September, an 11% m/m seasonal rebound amid active replenishment from jewellers in preparation for the expected sales boost during the early October National Day Holiday. Yet total withdrawals remain 18% below the 10-year average. Y-t-d, wholesale demand totalled 1,128t, an 11% y/y fall
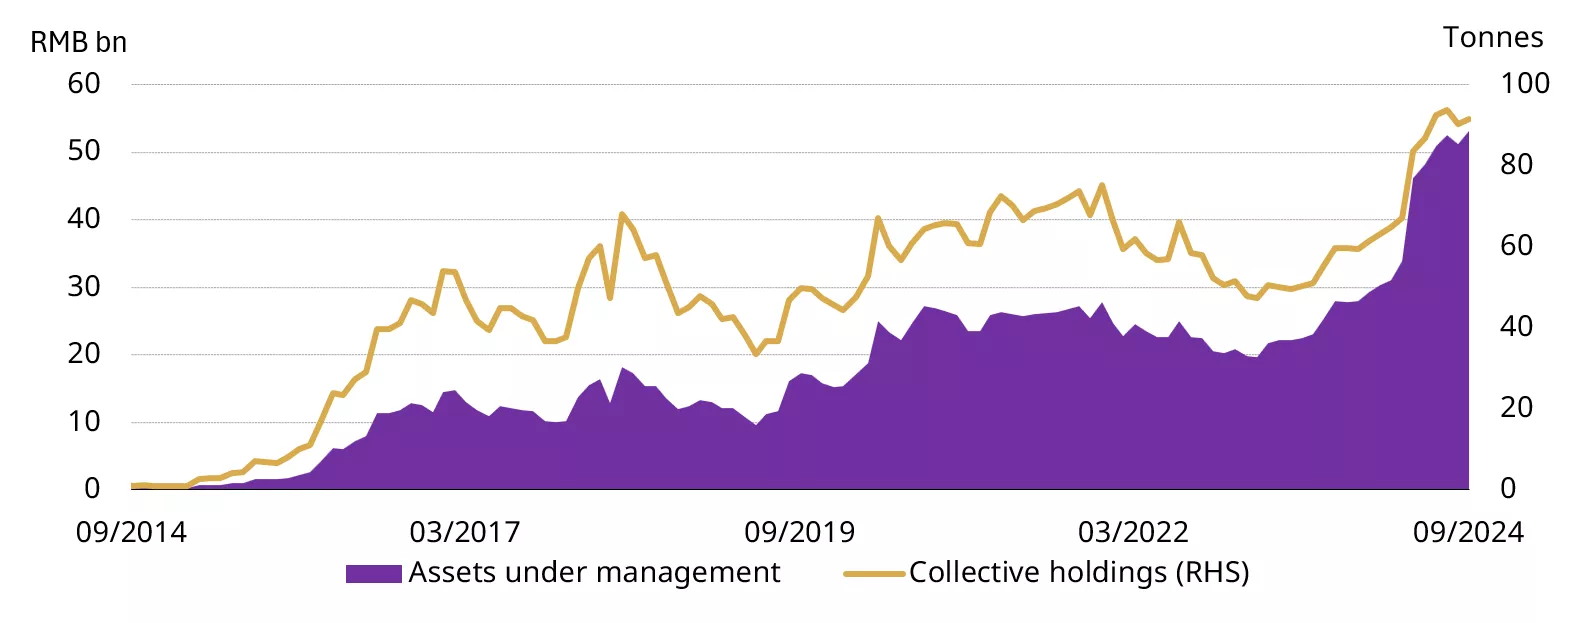
- Chinese gold ETF flows flipped positive in September, attracting RMB794mn (+US$110mn, +1.2t) amid the strong local gold price performance and pushing their total assets under management (AUM) to RMB53bn (US$7.8bn, 91.4t). Chinese gold ETF inflows have piled up to RMB16bn (+US$2.3bn, +30t) y-t-d, leading all other countries
- In contrast, volumes of gold futures at the Shanghai Futures Exchange (SHFE) declined by 25% m/m as the strong equity market performance and falling RMB gold price volatility likely distracted gold investors.
Looking ahead
- As Q4 arrives – the peak season for gold consumption – we expect gold demand to improve. And as the government’s aggressive stimulus package gradually unfolds and the potential of further fiscal support lies ahead,1 we believe an uplift in consumer confidence and disposable income should help support gold jewellery consumption.
- But on the other hand, as investor risk appetite picks up, investment demand for gold may slow.
Our upcoming report provides detailed analysis of the Chinese stimulus’ impacts on local gold demand in the future. Stay tuned!
Gold surged to another record high in September (Chart 1). Lower US Treasury yields and a weakening dollar – the Fed’s rate cut was larger than expected and investors anticipate further reductions – along with rising geopolitical tensions in the Middle East lifted gold prices. But due to a rapid appreciation in the RMB, driven by dollar weakness and an improved Chinese economic outlook, the SHAUPM in RMB saw limited gains relative to its USD peer.
Chart 1: Gold prices saw notable rises in September
Monthly changes of SHAUPM and LBMA Gold Price AM*
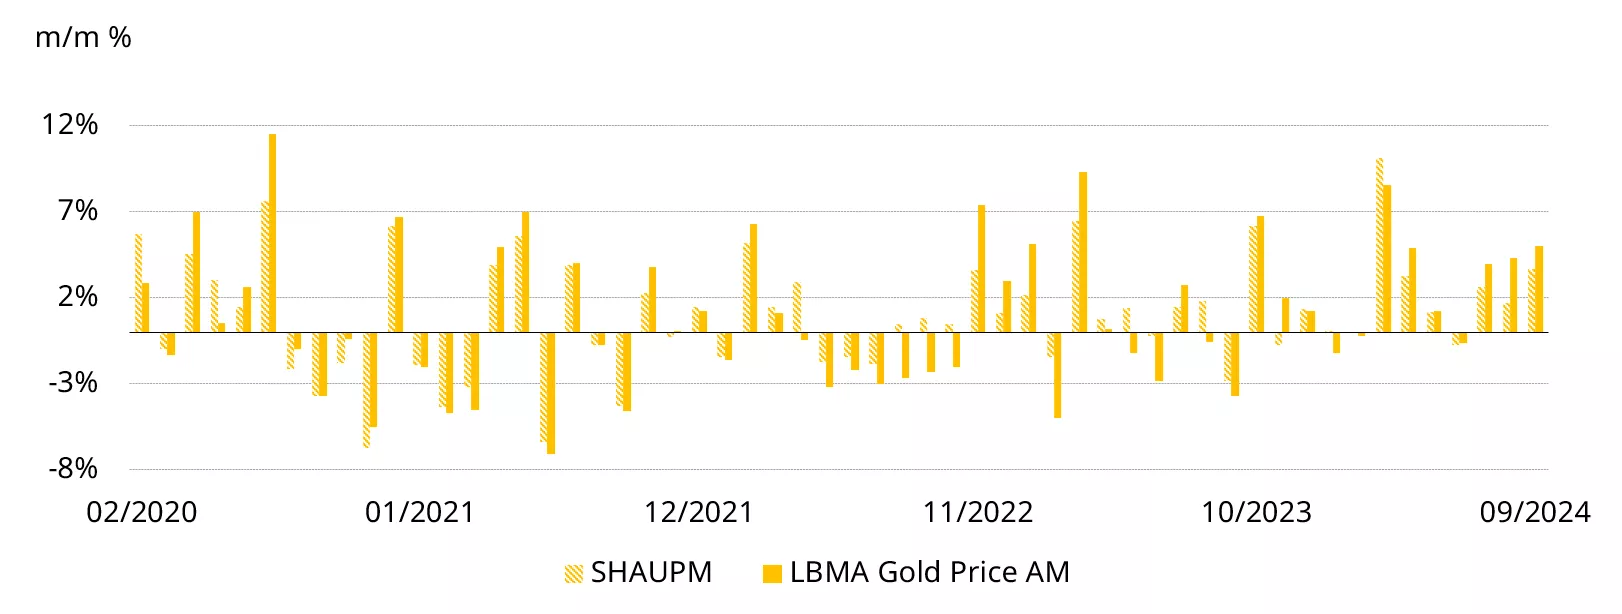
*Note: We compare the LBMA Gold Price AM to SHAUPM because the trading windows used to determine them are closer to each other than those for the LBMA Gold Price PM. For more information about Shanghai Gold Benchmark Prices please visit Shanghai Gold Exchange.
Source: Bloomberg, Shanghai Gold Exchange, World Gold Council
Chart 2: Gold has outperformed major assets so far in 2024*

*As of 30 September 2024. All calculations in RMB. Based on the SHAUPM, S&P500 Index, WTI Crude Oil, Bloomberg US Treasury Aggregate, CSI China Money Market Fund Index, Wind China Commodity Index, Bloomberg China Bond Aggregate, Shanghai Shenzhen 300 Stock Index, and the ChiNext Stock Index.
Source: Bloomberg, Shanghai Gold Exchange, World Gold Council
Gold withdrawals from the SGE continued to rebound in September, amounting to 115t, a 13% m/m rise (Chart 3). This is seasonal: retailers’ replenishment for the anticipated sales boost during the early October National Day Holiday and the upcoming peak season in Q4 drove up wholesale gold demand during September. But the y/y decline (-32%) reflects continued weakness in gold jewellery consumption amid a record-level gold price and decelerating economic growth. Bar and coin investment cooled too, impacted by uncertainty in the future price direction of gold and strength in competing assets; notably, equities were boosted by the recent aggressive economic stimuli announcement.
Chart 3: Wholesale gold demand continued its seasonal rebound
Gold withdrawals from the SGE in 2024 and the 10-year average*
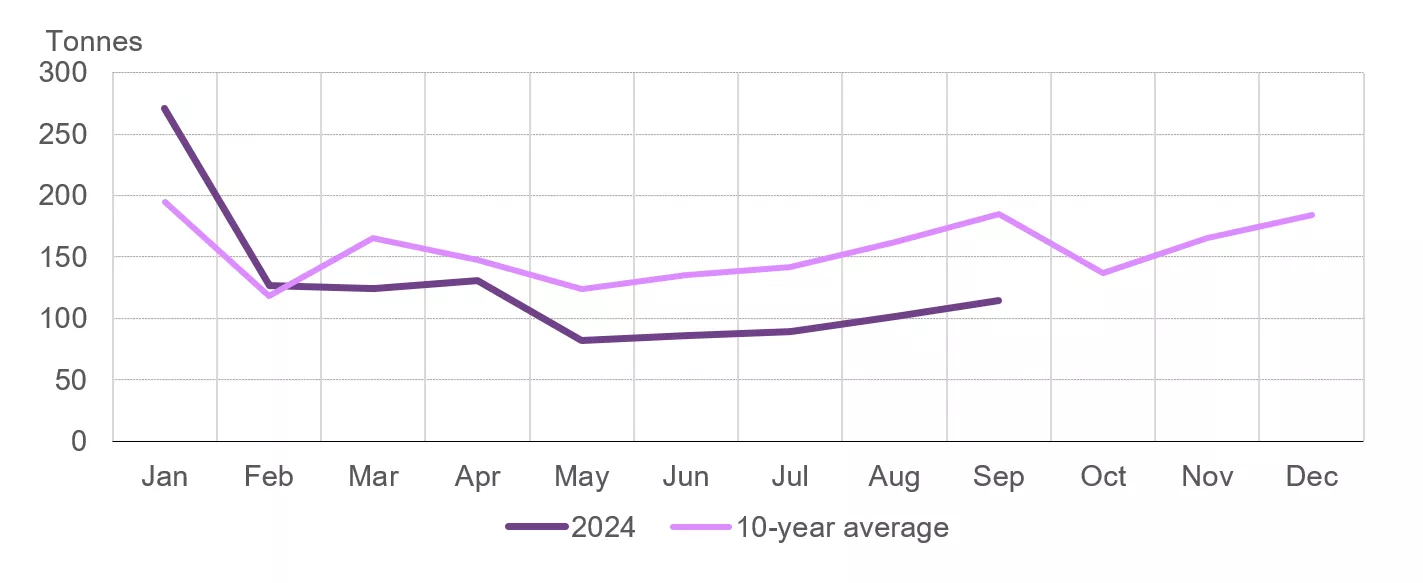
*10-year average based on data between 2014 and 2023.
Source: Shanghai Gold Exchange, World Gold Council
During the first three quarters, gold withdrawals from the SGE amounted to 1,128t, an 11% fall y/y and 18% below the 10-year average. In general, weakening gold jewellery demand and the deceleration in investment growth were the main contributors.
September saw Chinese gold ETF flows flip positive, attracting RMB794mn (+US$110mn) (Chart 4). While collective holdings increased by just 1.2t to 91.4t, the total AUM climbed 4% to RMB53bn (US$7.8bn), supported by inflows and a rising gold price. In general, we believe the record-shattering RMB gold price performance has been key in driving gold ETF inflows during the month. We believe that demand for gold ETFs would have been even stronger had investor attention not been diverted to Chinese equities.
Chart 4: Chinese gold ETFs attracted inflows in September
Chinese gold ETF AUM and holdings*
Source: ETF providers, Shanghai Gold Exchange, World Gold Council
Negative flows in August outweighed inflows during July and September, leading to mild net outflows of RMB533mn (-US$74mn, -1t) in Q3, the first quarterly outflow since Q2 2023. Nonetheless, thanks to strong inflows during H1, Chinese gold ETFs have captured RMB16bn (+US$2.3bn, +30t) y-t-d, outpacing every other country.
Gold futures trading volumes at the SHFE fell, averaging 172t in September, 25% lower m/m but 5% above their five-year average (Chart 5). The jump in local equities, which attracted tremendous attention from investors, and the declining RMB gold price volatility may have lowered interest from tactical traders.
Chart 5: SHFE gold futures volumes fell m/m in September
Monthly and five-year average trading volumes in the active gold futures contract*
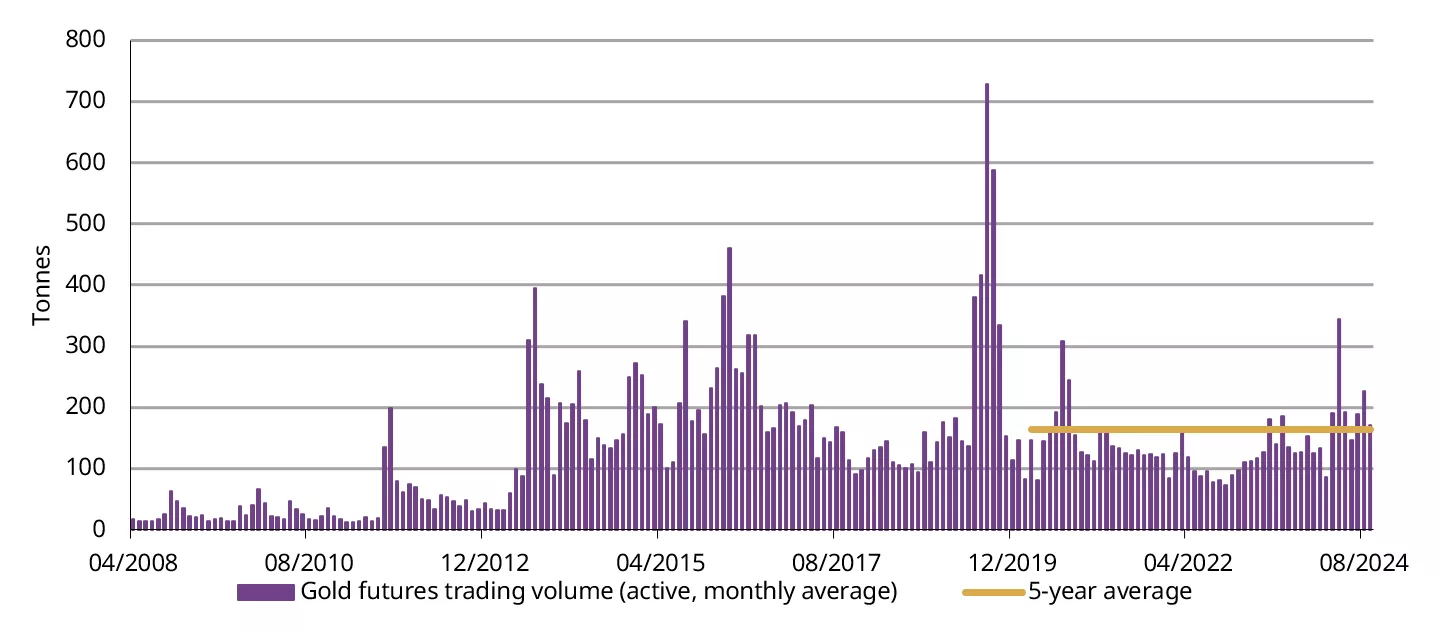
*Based on the average daily trading volumes (by month) of the active gold futures contract.
Source: Shanghai Futures Exchange, World Gold Council
Gold imports almost came to a halt in August, based on the latest data from China Customs (Chart 6). Despite a mild m/m rebound in wholesale gold demand during August, China’s net gold imports only amounted to 10t, 27t lower than a very weak July, marking the lowest since February 2021 when COVID-related restrictions limited imports. We believe this was mainly driven by:
- The local gold price discount, which discouraged importers
- Still subdued gold demand – while there was a m/m rebound in gold withdrawals from the SGE in August, they stayed well below the 2023 level and the long-term average.
Chart 6: Gold imports kept falling*
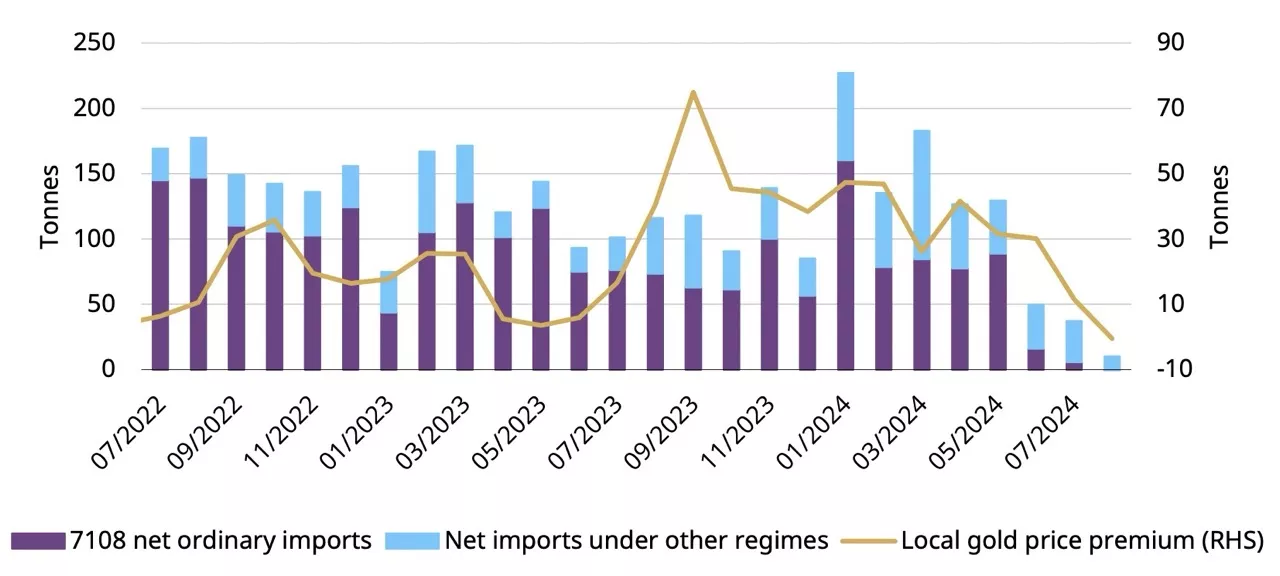
*Based on all imports under HS code 7108 reported by China Customs and excluding exports.
Source: China Customs, World Gold Council
China’s official gold holdings stood at 2,264t in September, unchanged for the fifth consecutive month. Nonetheless, by the end of the month, gold’s share of China’s foreign exchange reserves rose to 5.4%, thanks to the higher gold price. So far in 2024, China’s reported gold purchases total 29t, all of which were accumulated between January and April.
For more information on central bank gold purchases, please visit: Central Banks Gold Reserves by Country
