China’s gold market update: Investment boom continues in March
14 April, 2025
Highlights
- March was another exceptional month for gold: the Shanghai Benchmark Gold Price PM and the LBMA Gold Price PM surged by 8.4% and 9.9% respectively, both concluding Q1 with performances unprecedented in decades
- Gold withdrawals from the Shanghai Gold Exchange (SGE) rebounded following the holiday slowdown in February; this, combined with strong investment, likely boosted the local gold price premium in March; however, Q1 wholesale gold demand fell 36% y/y amid January and February weakness
- Chinese gold ETFs attracted RMB5.6bn (US$772mn) in March, pushing total assets under management (AUM) to RMB101bn (US$14bn) and holdings 7.7t higher to 138t; Q1 inflows reached a record high
- The People’s Bank of China (PBoC) has been adding gold to its reserves for five consecutive months: March saw a 2.8t reported addition to China’s official gold holdings and Q1 ended with a net gain of 12.8t
- Gold imports during the first two months of 2025 were tepid on weak demand and local price discounts during the period.
Looking ahead
- Gold investment demand should stay strong in the short term, as the escalating US-China trade war hurts growth and local assets. The global gold price strength, boosted by a re-structuring of the world trade order and world market volatility, will provide further support
- Subsequent to policy changes Chinese insurers have entered the gold market: four companies became SGE members on 24 March and executed their first trades of SGE gold contracts the following day. Their participation should sustain long-term investment demand for gold in China, especially amid ongoing economic and trade uncertainties
- Despite the upcoming May Labour Day holiday sales boost, record high gold prices and economic worries are clouding the jewellery demand outlook – though safe-haven buying may offer a cushion.
Our Gold Demand Trends Q1 2025 report launches on 30 April, with an in-depth analysis and outlook on gold demand across key markets. Stay tuned!
Another month, another record high
Gold’s rally continued in March (Chart 1). The SHAUPM in RMB saw its strongest month for a year while the March return of the LBMA Gold Price PM in USD reached its highest since July 2020. Geopolitical tensions and Trump's unpredictable trade policies increased gold's appeal as a safe-haven asset. A weaker dollar and higher gold ETF investments pushed up prices further.
Chart 1: Gold prices showed continued strength in March
Monthly returns of the SHAUPM in RMB and the LBMA Gold Price PM in USD*
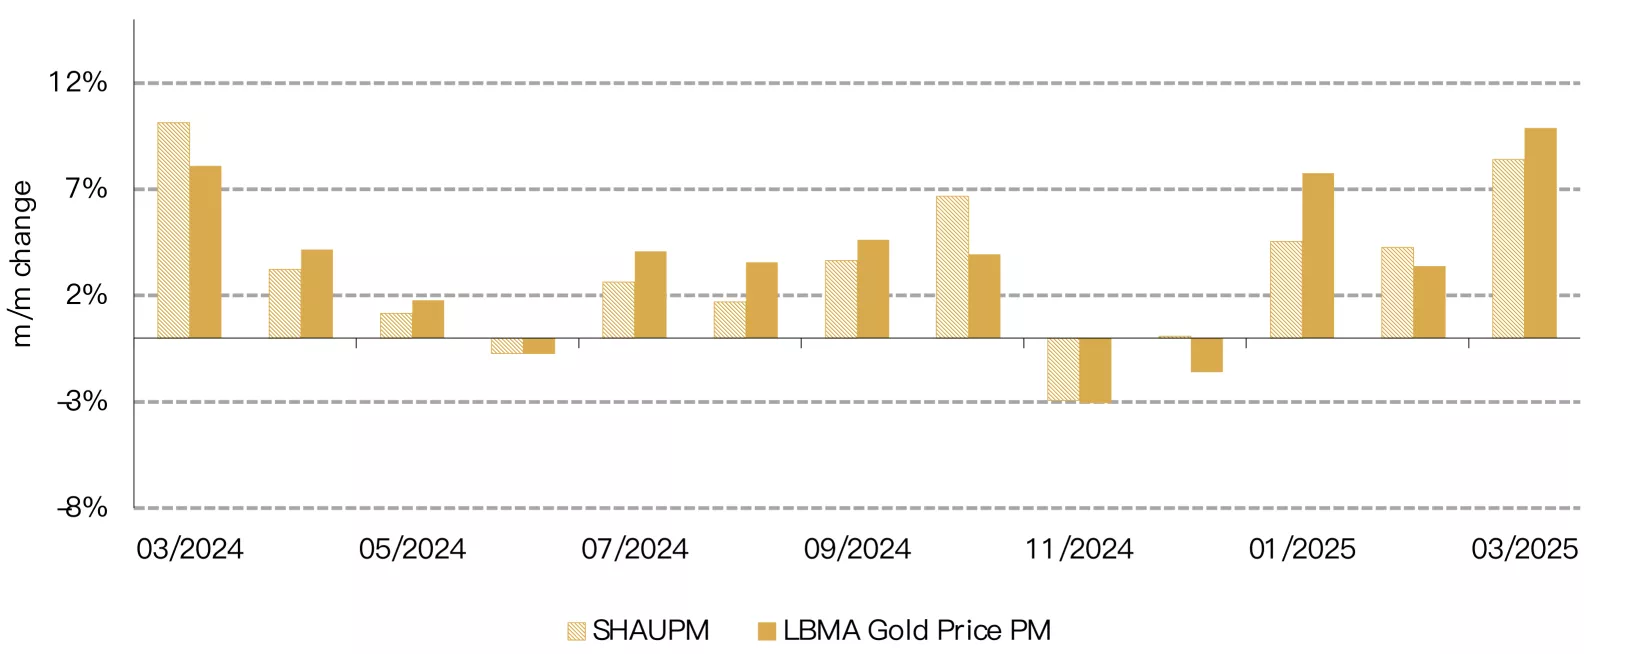
*February return based on prices between 27 January – the last trading day before the CNY holiday – and 28 February 2025 to account for holiday impact.
Source: Bloomberg, World Gold Council
March ended Q1 on a strong note with both RMB and USD gold prices jumping 19% (Chart 2). The RMB gold price recorded its strongest Q1 since 2002 – when the SGE was established – and the USD price posted its best Q1 return since 1975. Key drivers included:
- The rising safe-haven demand amid global geopolitical and trade policy risks
- A weaker dollar on concerns around US growth and shifting expectations of the Fed’s future cuts
- Strong momentum as global gold ETFs attracted notable inflows.
Chart 2: Record Q1 gold price strength
Q1 returns of the Au9999 in RMB and the LBMA Gold Price PM in USD*
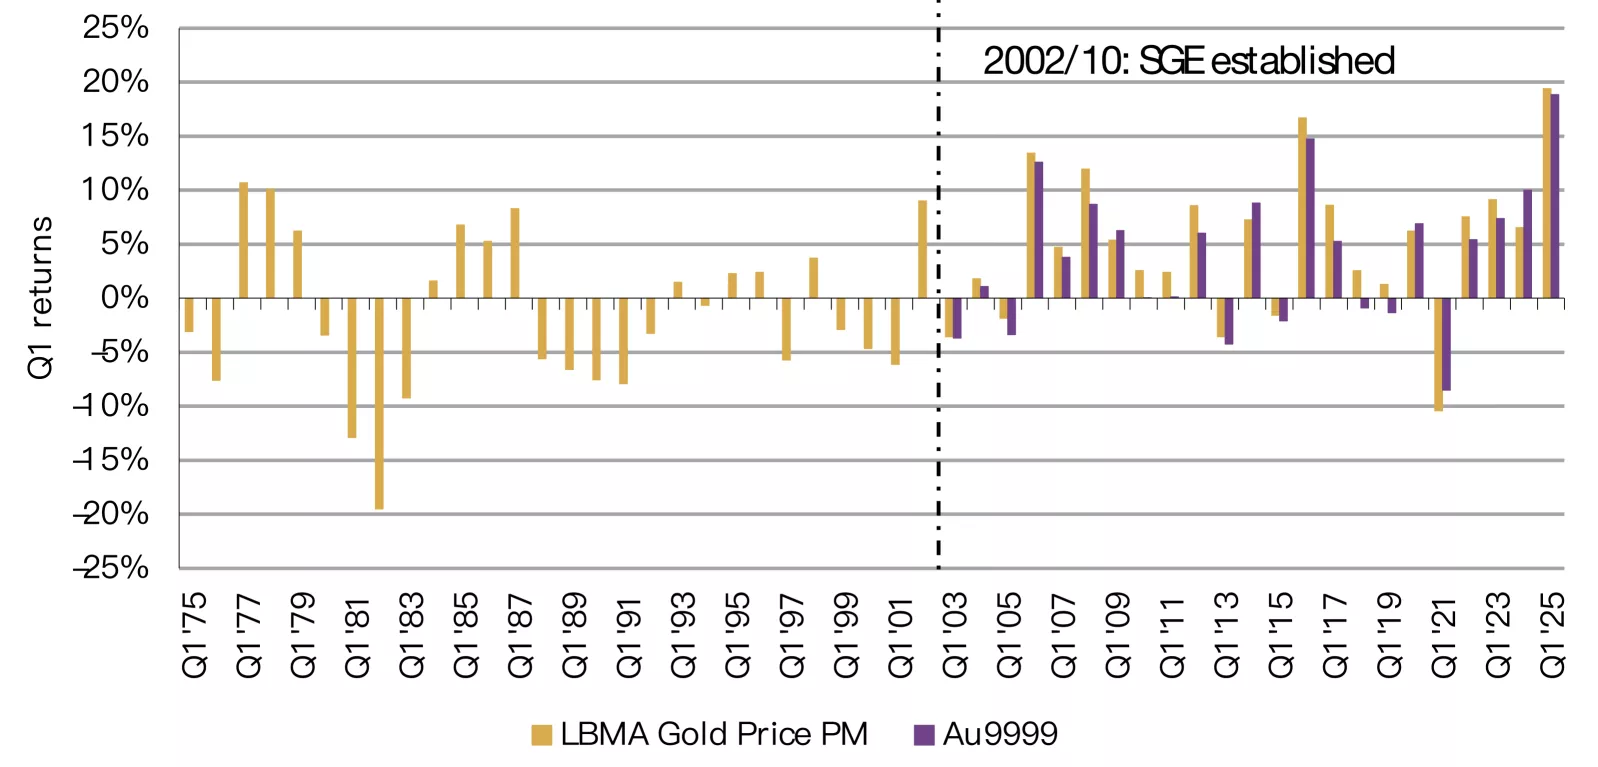
*We use AU9999 gold price in RMB here as it has a longer history than SHAUPM.
Source: Bloomberg, World Gold Council
Wholesale demand weakened in Q1 despite a m/m rebound in March
Gold withdrawals from the SGE totalled 120t in March, up 30t m/m but slightly lower y/y. The m/m rebound came as jewellers and banks restocked after the Chinese New Year holiday slowdown – a seasonal pattern. Continued strength in investment demand for gold may also have provided a boost. We believe a pickup in wholesale gold demand resulted in the improving local gold price premium in March (US$4.3/oz on average vs a US$1.5/oz discount in February).
Chinese wholesale gold demand totalled 336t in Q1, 29% below the ten-year average and a 36% fall y/y (Chart 3). We believe this weakness can be mainly attributed to:
- A high base – 2024 witnessed the strongest January wholesale demand on record
- A surging gold price – the record-shattering gold price hampered gold jewellery demand, a major factor in SGE gold withdrawals, although it did boost gold investment.
Chart 3: Wholesale demand weakened notably in Q1 despite a rebound in March
Gold withdrawals from the SGE*
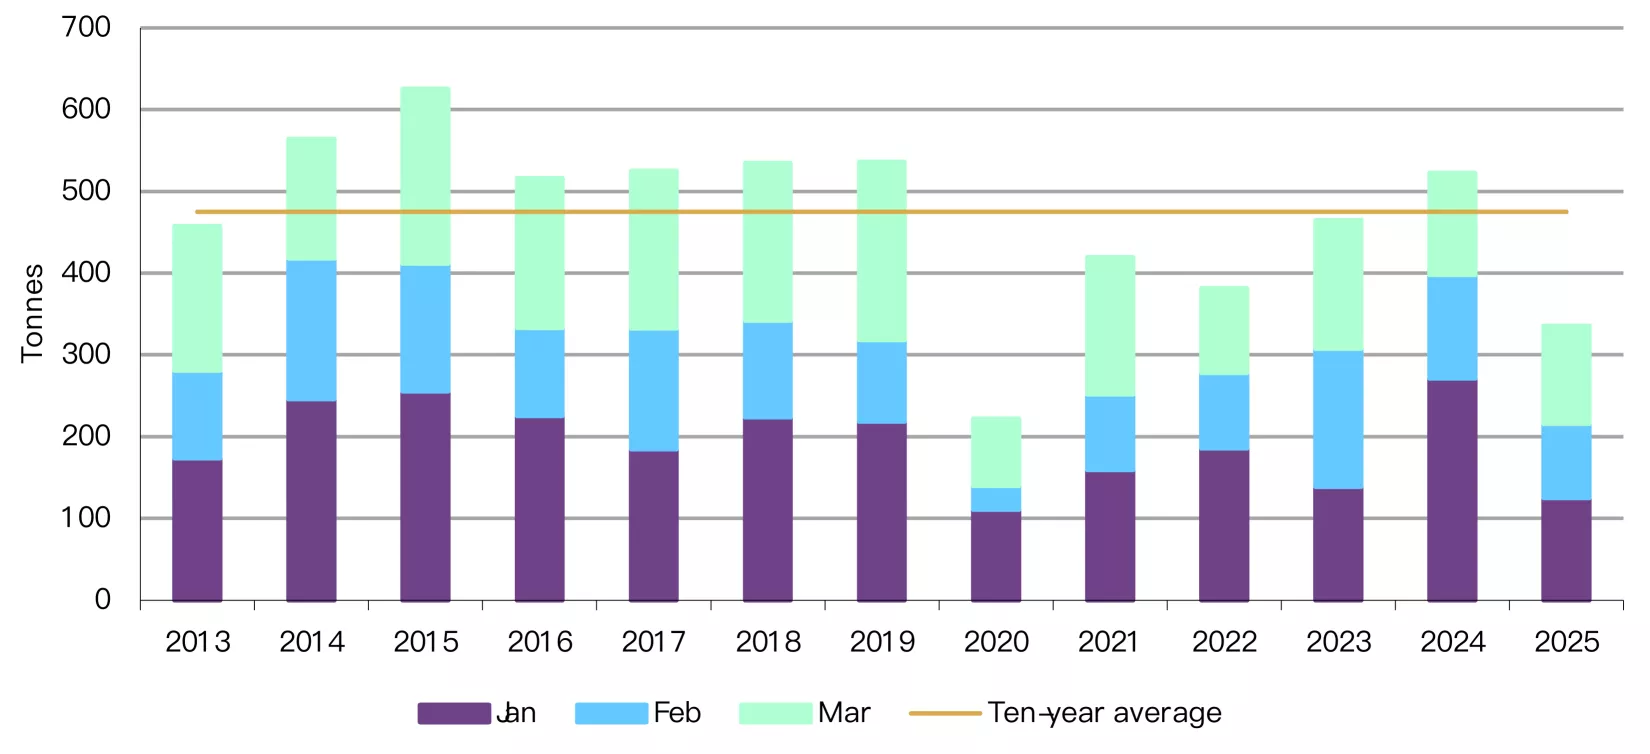
*As of Q1 2025. 10-year average based on Q1 totals between 2015 and 2024.
Source: Shanghai Gold Exchange, World Gold Council
Chinese investors continue to buy gold ETFs at a robust pace
Inflows into Chinese gold ETFs sustained for a second month, totalling RMB5.6bn (US$772mn) in March. Continued inflows and the surging gold price pushed the total AUM to another month-end peak of RMB101bn (US$14bn). Collective holdings rose further by 7.7t to 138t, also a record high (Chart 4). The soaring gold price remained a key driver for healthy Chinese gold ETF inflows during March, while global trade uncertainties and concerns around their impact on the local economy provided an additional boost.
Chart 4: AUM of Chinese gold ETFs continued to grow
Collective holdings and AUM of Chinese gold ETFs*
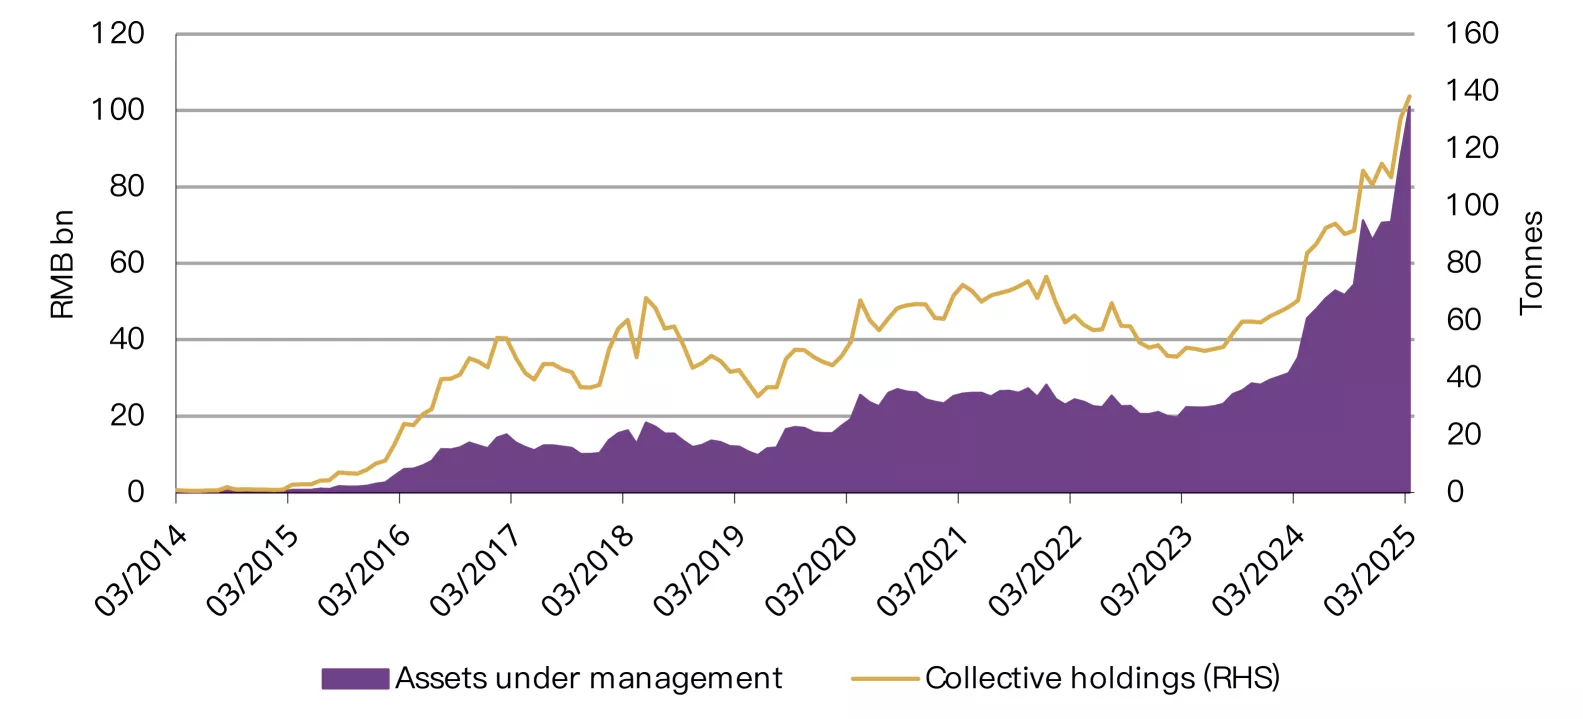
*As of 31 March 2025.
Source: Company filings, World Gold Council
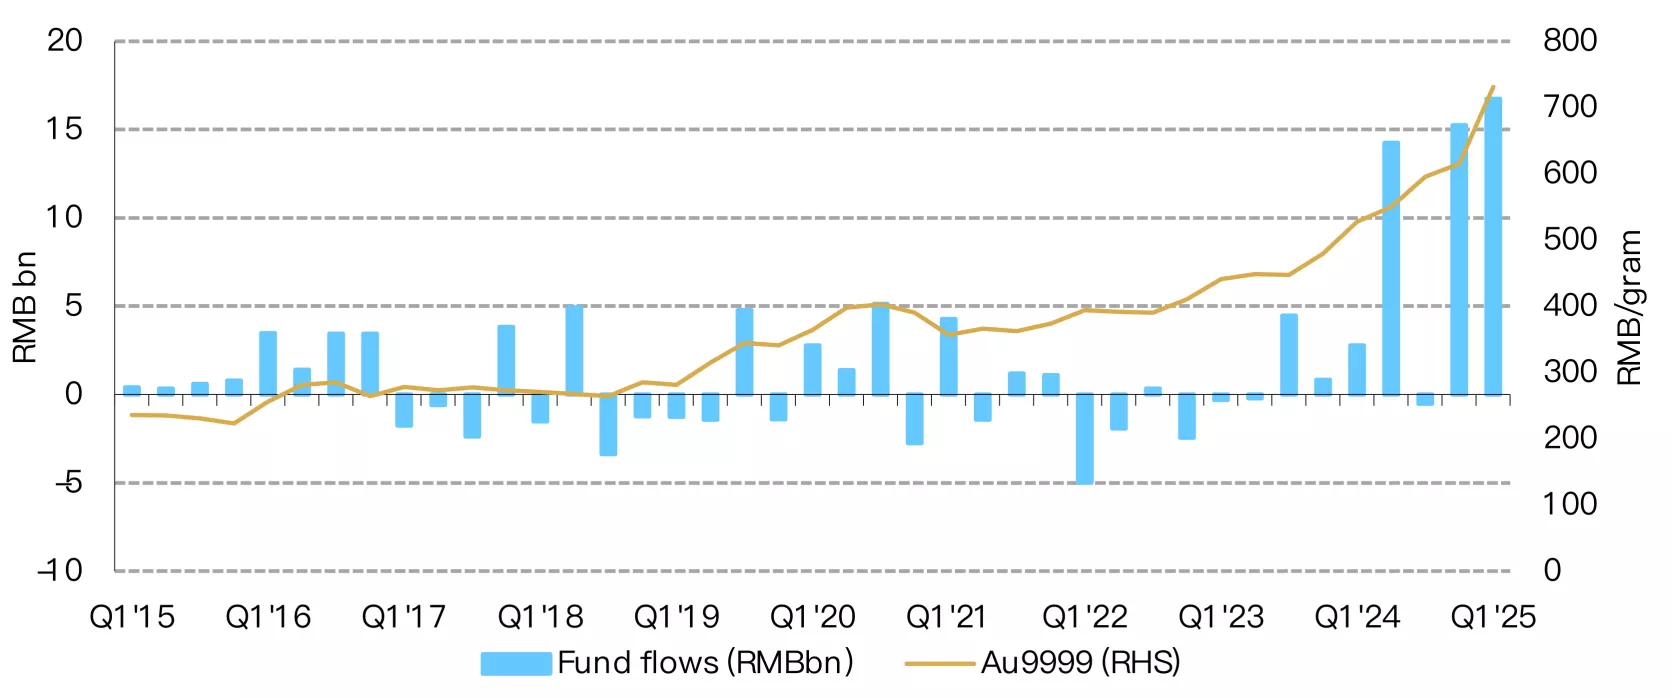
Strong demand in February and March led to a record quarter for Chinese gold ETF inflows (Chart 5). The first quarter of 2025 saw inflows of RMB16.7bn (US$2.3bn), equivalent to a 23t increase in holdings – both reaching record levels. The unprecedented gold price surge, shaky confidence in other domestic assets, as well as growth concerns stemming from escalating trade conflicts with the US, all contributed to strong Q1 flows.
And it is worth noting that record inflows continued into Q2. During the first two weeks of April, Chinese gold ETFs’ collective holdings surged another 29t whilst total AUM rocketed 25% on sustained gold price strength and escalating trade tensions with the US.
Chart 5: Unseen price strength brings in unprecedented Q1 inflows
Quarterly RMB gold price performance and Chinese gold ETF inflows*
*As of 31 March 2025.
Source: Shanghai Gold Exchange, ETF providers, World Gold Council
China’s gold reserves rose further in March
The PBoC has announced gold purchases in each of the past five months, and in March, added a further 2.8t (Chart 6). This pushes China’s official gold holdings to 2,292t, or 6.5% of total reserves. During Q1 2025 China reported purchases of 12.8t of gold.
Chart 6: China’s official gold reserves expand for five months in a row
Reported official gold holdings and gold as a percentage of total foreign exchange reserves*
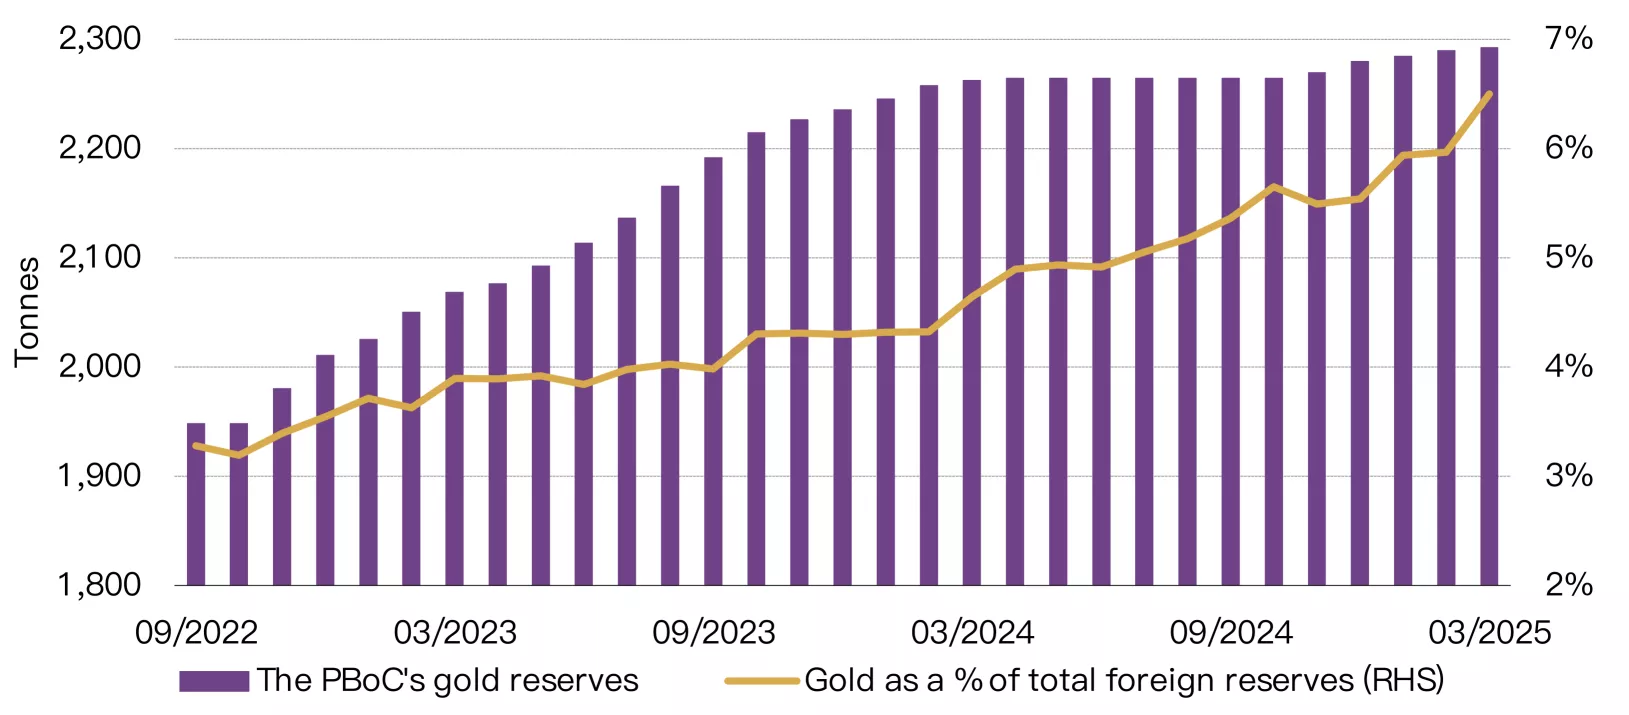
*As of 31 March 2025.
Source: Administration of Foreign Exchange, World Gold Council
Over the course of Q1 China’s total reserves rose by 2.3% to US$3.5tn, supported mainly by:
- A weaker dollar, which pushed up USD denominated assets
- Falling US yields, which lifted bond values
- Rising gold holdings and a surging gold price, which surged 20% to US$230bn and contributed over 1% to the quarterly increase in total reserves.
Imports remained tepid at the start of 2025
Gold imports into China virtually came to a halt in January, amounting to just 17t, the lowest monthly value since February 2021 – at which time imports were hampered by COVID restrictions. February imports picked up, rising to 76t. Nonetheless, they remained well below the 2024 monthly average of 102t.
And the weakness is more obvious on a netting basis. Net ordinary imports fell to zero in January, the lowest since early 2021; they rebounded to 49t in February, yet still represented a 38% y/y plunge. We believe fewer working days due to the Chinese New Year’s holiday, weak domestic gold demand and local gold price discounts during most of the period – which discouraged importers – were the main drivers.
Chart 7: Imports lowered notably at the start of 2025
7108 gold imports under various regimes*
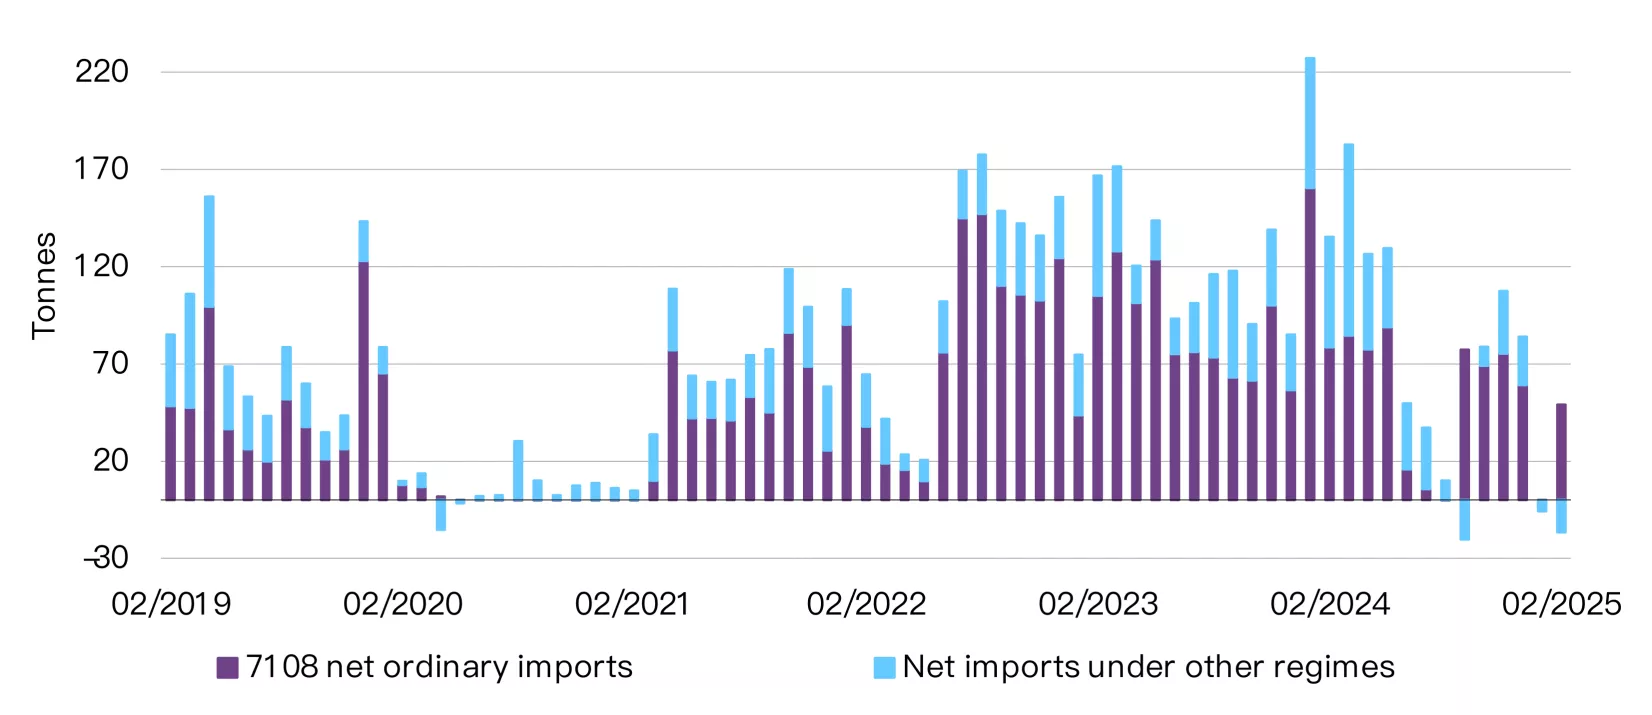
*Based on the latest data available.
Source: China Customs, World Gold Council
Disclaimer
Important information and disclaimers
© 2025 World Gold Council. All rights reserved. World Gold Council and the Circle device are trademarks of the World Gold Council or its affiliates.
All references to LBMA Gold Price are used with the permission of ICE Benchmark Administration Limited and have been provided for informational purposes only. ICE Benchmark Administration Limited accepts no liability or responsibility for the accuracy of the prices or the underlying product to which the prices may be referenced. Other content is the intellectual property of the respective third party and all rights are reserved to them.
Reproduction or redistribution of any of this information is expressly prohibited without the prior written consent of World Gold Council or the appropriate copyright owners, except as specifically provided below. Information and statistics are copyright © and/or other intellectual property of the World Gold Council or its affiliates or third-party providers identified herein. All rights of the respective owners are reserved.
The use of the statistics in this information is permitted for the purposes of review and commentary (including media commentary) in line with fair industry practice, subject to the following two pre-conditions: (i) only limited extracts of data or analysis be used; and (ii) any and all use of these statistics is accompanied by a citation to World Gold Council and, where appropriate, to Metals Focus or other identified copyright owners as their source. World Gold Council is affiliated with Metals Focus.
The World Gold Council and its affiliates do not guarantee the accuracy or completeness of any information nor accept responsibility for any losses or damages arising directly or indirectly from the use of this information.
This information is for educational purposes only and by receiving this information, you agree with its intended purpose. Nothing contained herein is intended to constitute a recommendation, investment advice, or offer for the purchase or sale of gold, any gold-related products or services or any other products, services, securities or financial instruments (collectively, “Services”). This information does not take into account any investment objectives, financial situation or particular needs of any particular person.
Diversification does not guarantee any investment returns and does not eliminate the risk of loss. Past performance is not necessarily indicative of future results. The resulting performance of any investment outcomes that can be generated through allocation to gold are hypothetical in nature, may not reflect actual investment results and are not guarantees of future results. The World Gold Council and its affiliates do not guarantee or warranty any calculations and models used in any hypothetical portfolios or any outcomes resulting from any such use. Investors should discuss their individual circumstances with their appropriate investment professionals before making any decision regarding any Services or investments.
This information may contain forward-looking statements, such as statements which use the words “believes”, “expects”, “may”, or “suggests”, or similar terminology, which are based on current expectations and are subject to change. Forward-looking statements involve a number of risks and uncertainties. There can be no assurance that any forward-looking statements will be achieved. World Gold Council and its affiliates assume no responsibility for updating any forward-looking statements.
Information regarding QaurumSM and the Gold Valuation Framework
Note that the resulting performance of various investment outcomes that can be generated through use of Qaurum, the Gold Valuation Framework and other information are hypothetical in nature, may not reflect actual investment results and are not guarantees of future results. Neither World Gold Council (including its affiliates) nor Oxford Economics provides any warranty or guarantee regarding the functionality of the tool, including without limitation any projections, estimates or calculations.
