China’s gold market in October: unseen price records bring unprecedented gold ETF inflows
13 November, 2024
Key highlights:
- Gold’s rising streak extended to four months. The LBMA Gold Price AM in USD increased by 4.9% and the Shanghai Gold Benchmark PM (SHAUPM) in RMB jumped 6.7% – due mainly to a weaker local currency.
- A total of 107t gold left Shanghai Gold Exchange (SGE) in October, a m/m decline of 6%. Disappointing sales boost during the early October Golden Week and ample stocks – replenished in September – weakened wholesale demand. Meanwhile, the y/y weakness prevailed, falling 11% compared to last October and 21% below the 10-year average.
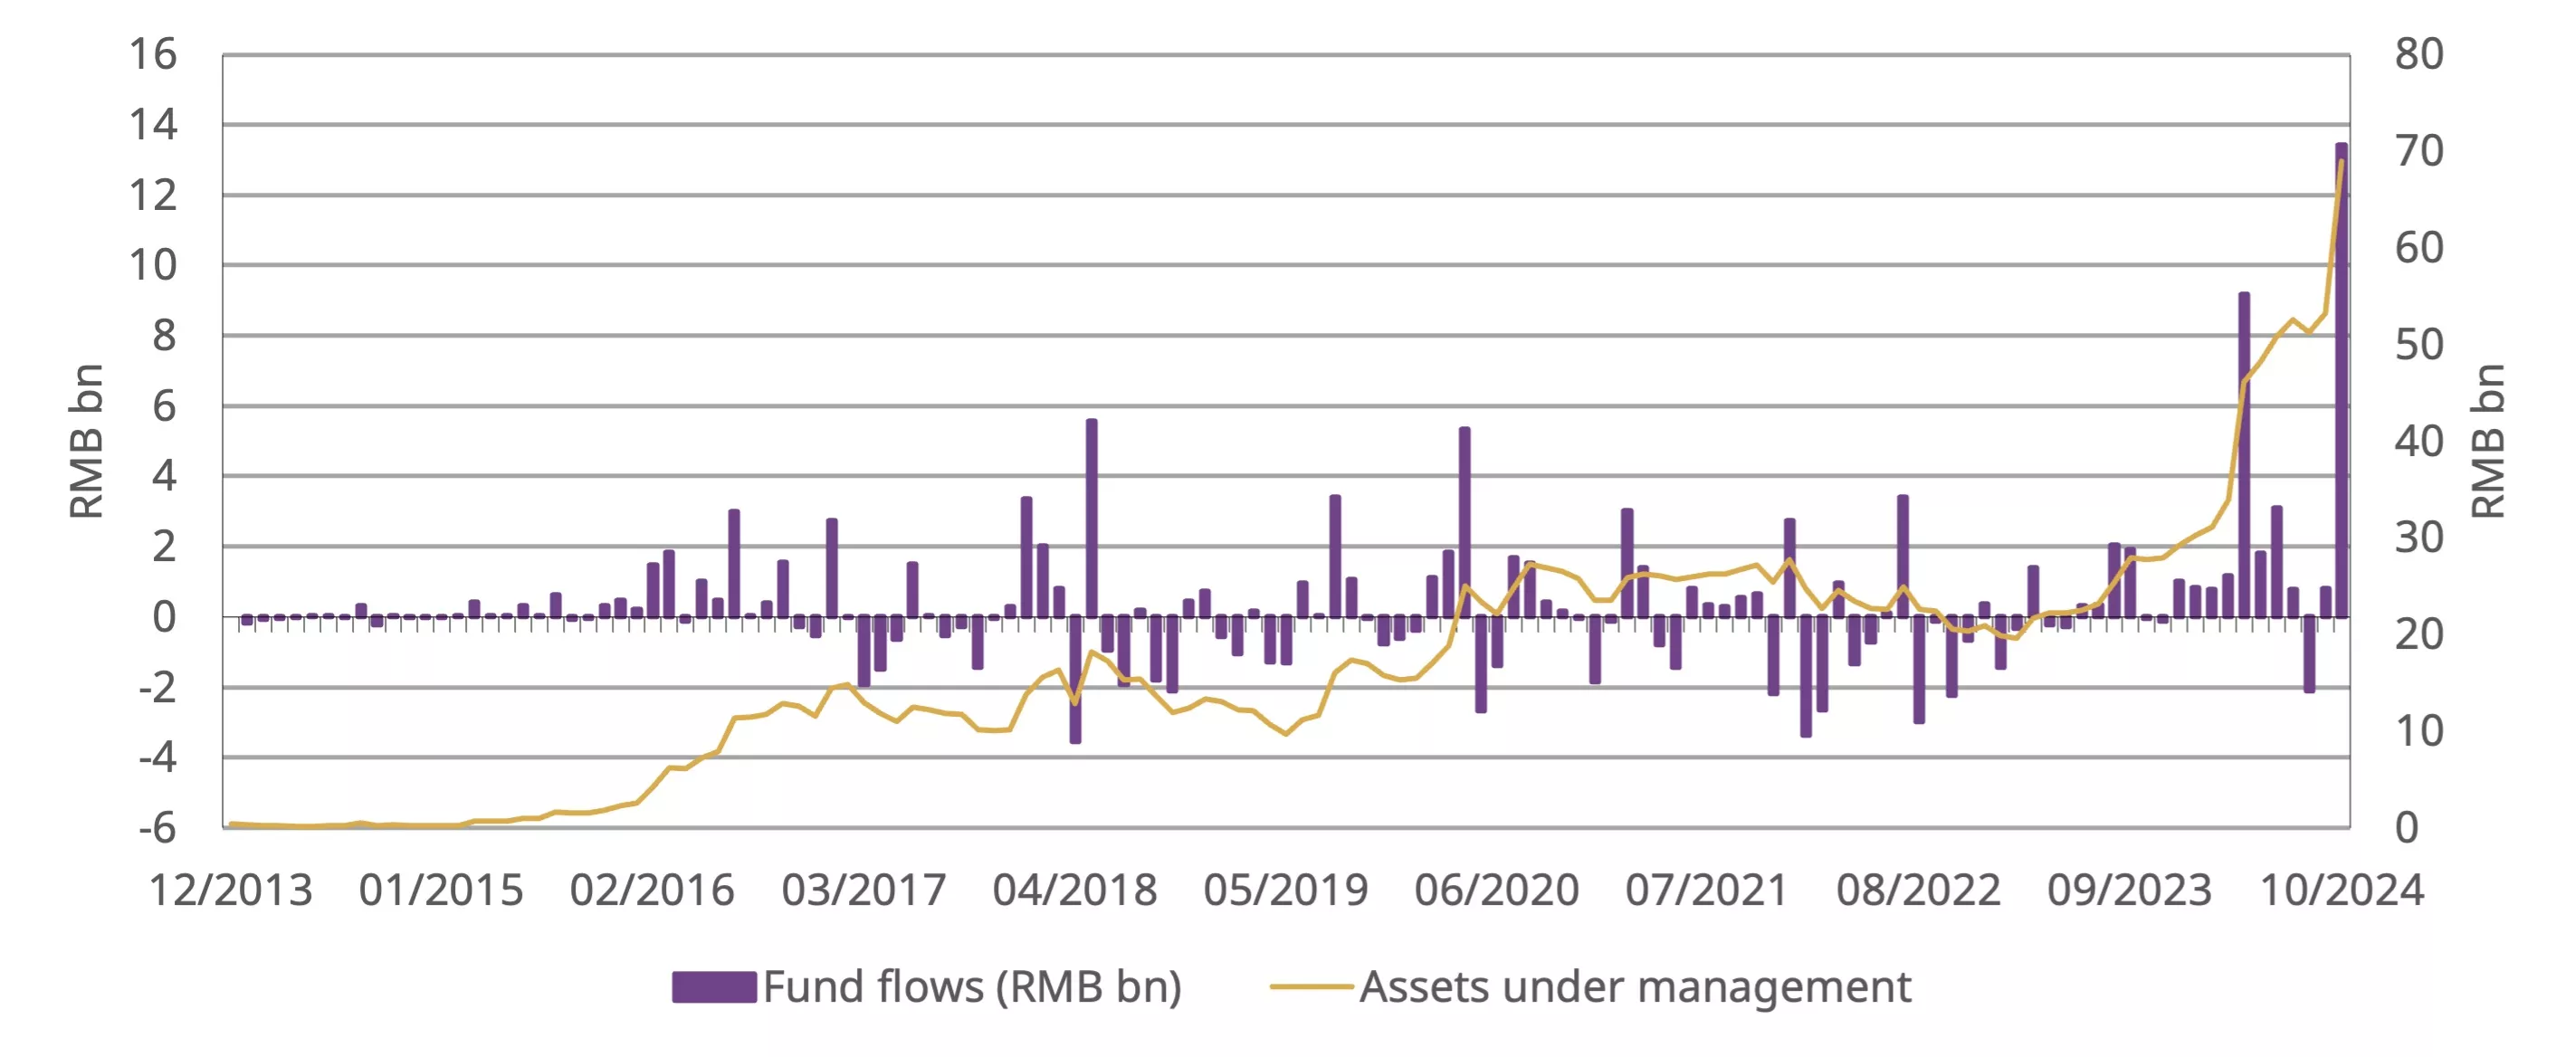
- Demand for Chinese gold ETFs surged, adding RMB13bn (+US$1.8bn, +21t) in October, the largest monthly inflow ever. Their total assets under management (AUM) surged to RMB69bn (US$10bn) and collective holdings reached 112t, both recording their historical highs.
- The gold price rally also ignited investor interest in gold futures at the Shanghai Futures Exchange (SHFE), resulting in a 32% m/m jump in the average daily trading volumes during October.
Looking ahead
- Amidst the stabilising local gold price and seasonality, we expect wholesale gold demand to rebound in coming months.
- Meanwhile, high-frequency indicators including services and manufacturing Purchasing Managers Index (PMI) have picked up notably in October, reflecting the boost from recent stimulus. And with most commercial banks starting to cut mortgage rates and allowing more frequent rate repricing cycles, households’ disposable income growth may receive some support.1 In general, improved economic growth momentum should be beneficial to Chinese gold consumption.
- But it is also important to reiterate that as China’s property market revives, bar and coin investment may face some competition as real estate is another key traditional value-preservation channel for Chinese households.2
Gold’s rally continued in October (Chart 1). Despite higher opportunity costs – namely the rising US Treasury yield and a stronger dollar – elevated safe-haven demand to hedge against geopolitical risks in the Middle East and uncertainties of the US election supported gold during the month.
Chart 1: The gold price rally streak extended to four months
Monthly changes of SHAUPM and LBMA Gold Price AM*
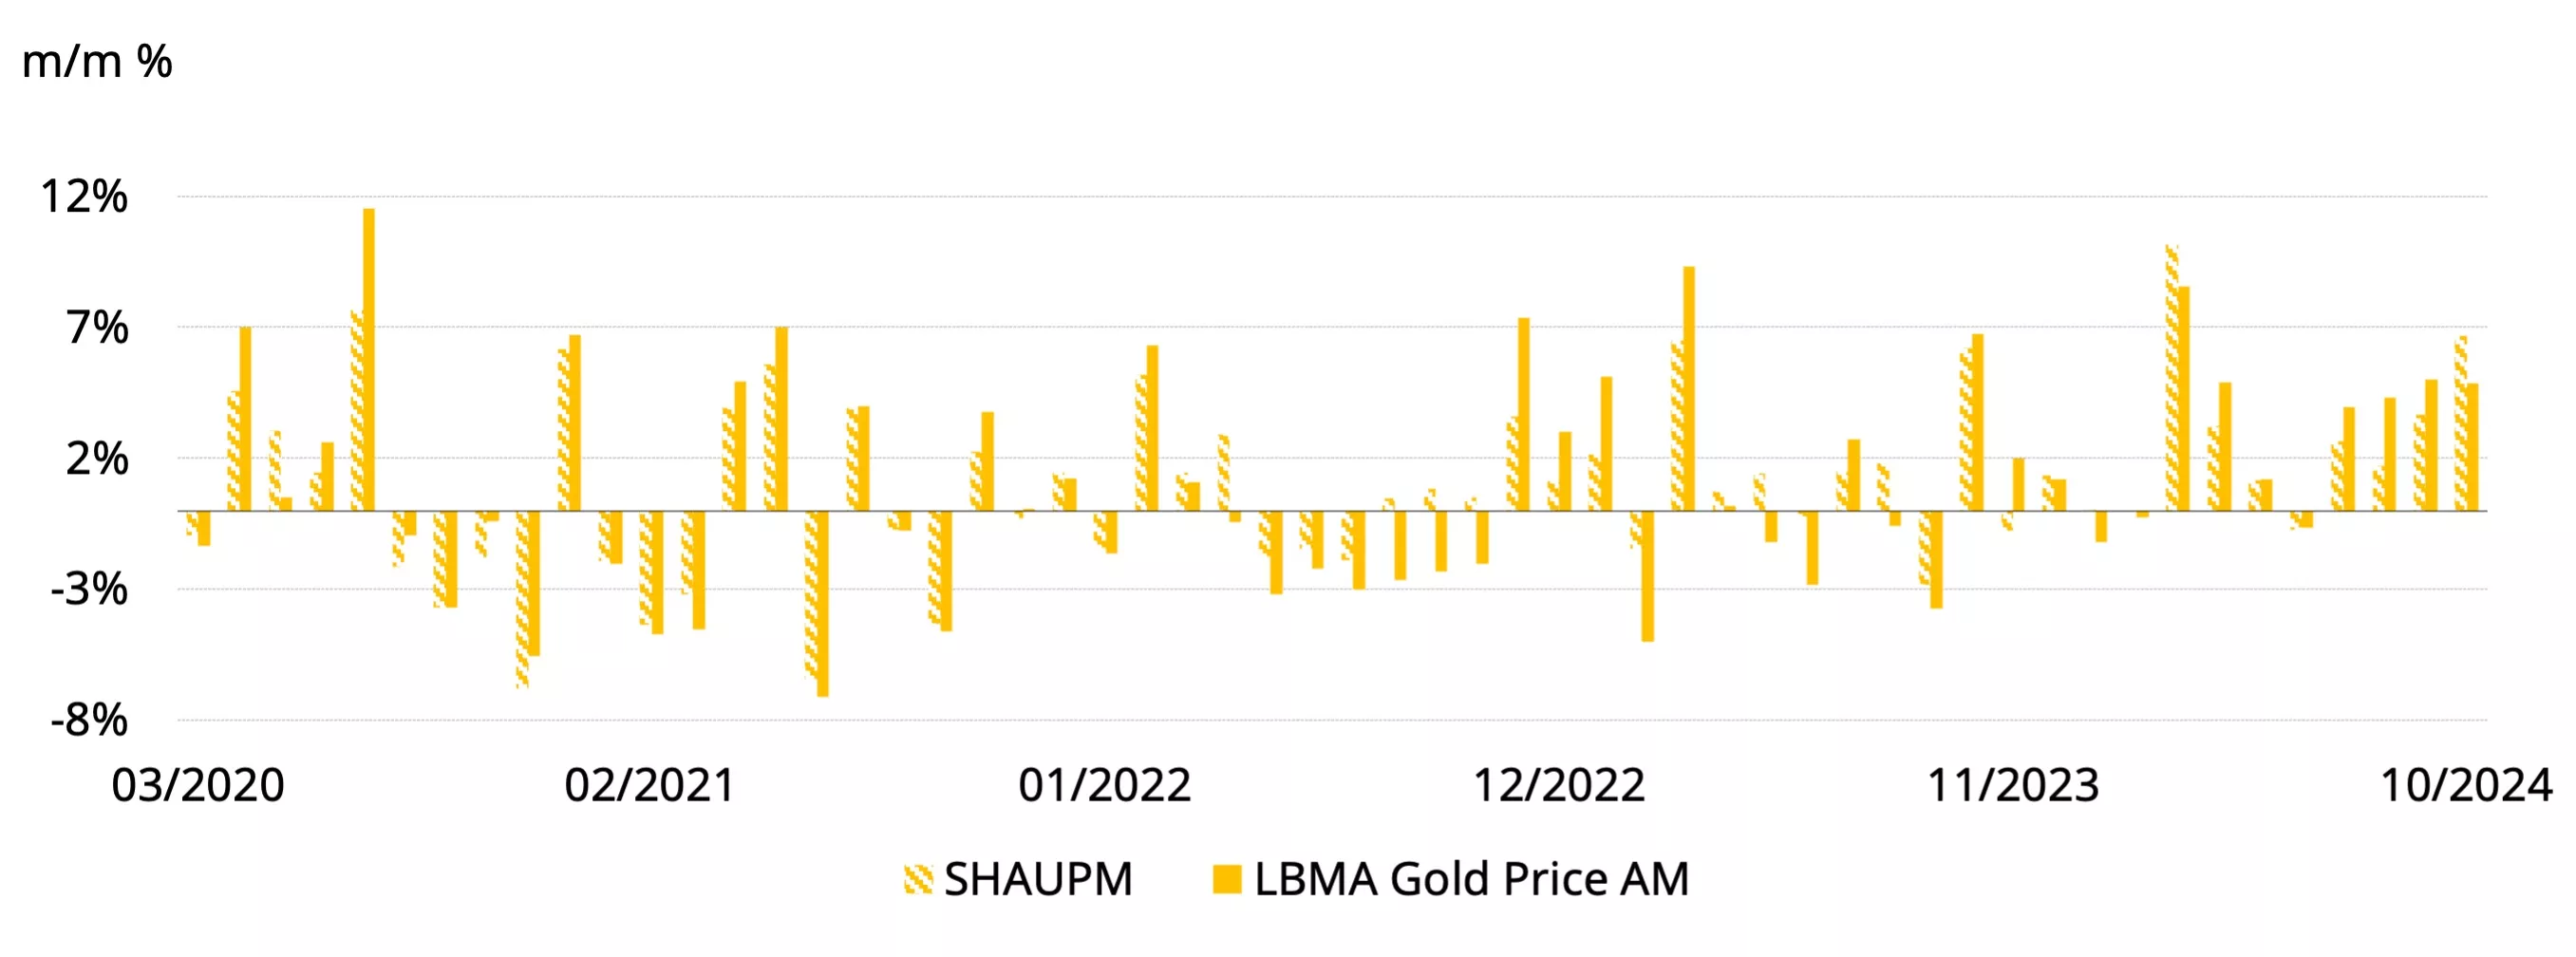
*Note: We compare the LBMA Gold Price AM to SHAUPM because the trading windows used to determine them are closer to each other than those for the LBMA Gold Price PM. For more information about Shanghai Gold Benchmark Prices please visit Shanghai Gold Exchange.
Source: Bloomberg, Shanghai Gold Exchange, World Gold Council
Another strong month took the RMB gold price’s y-t-d return to 29%, the best year so far since the SGE’s establishment in 2002 (Chart 2). And it is also worth noting that the local gold price has refreshed record highs 39 times so far in 2024, attracting tremendous investor attention.
Chart 2: Gold has repeatedly refreshed record highs so far this year*
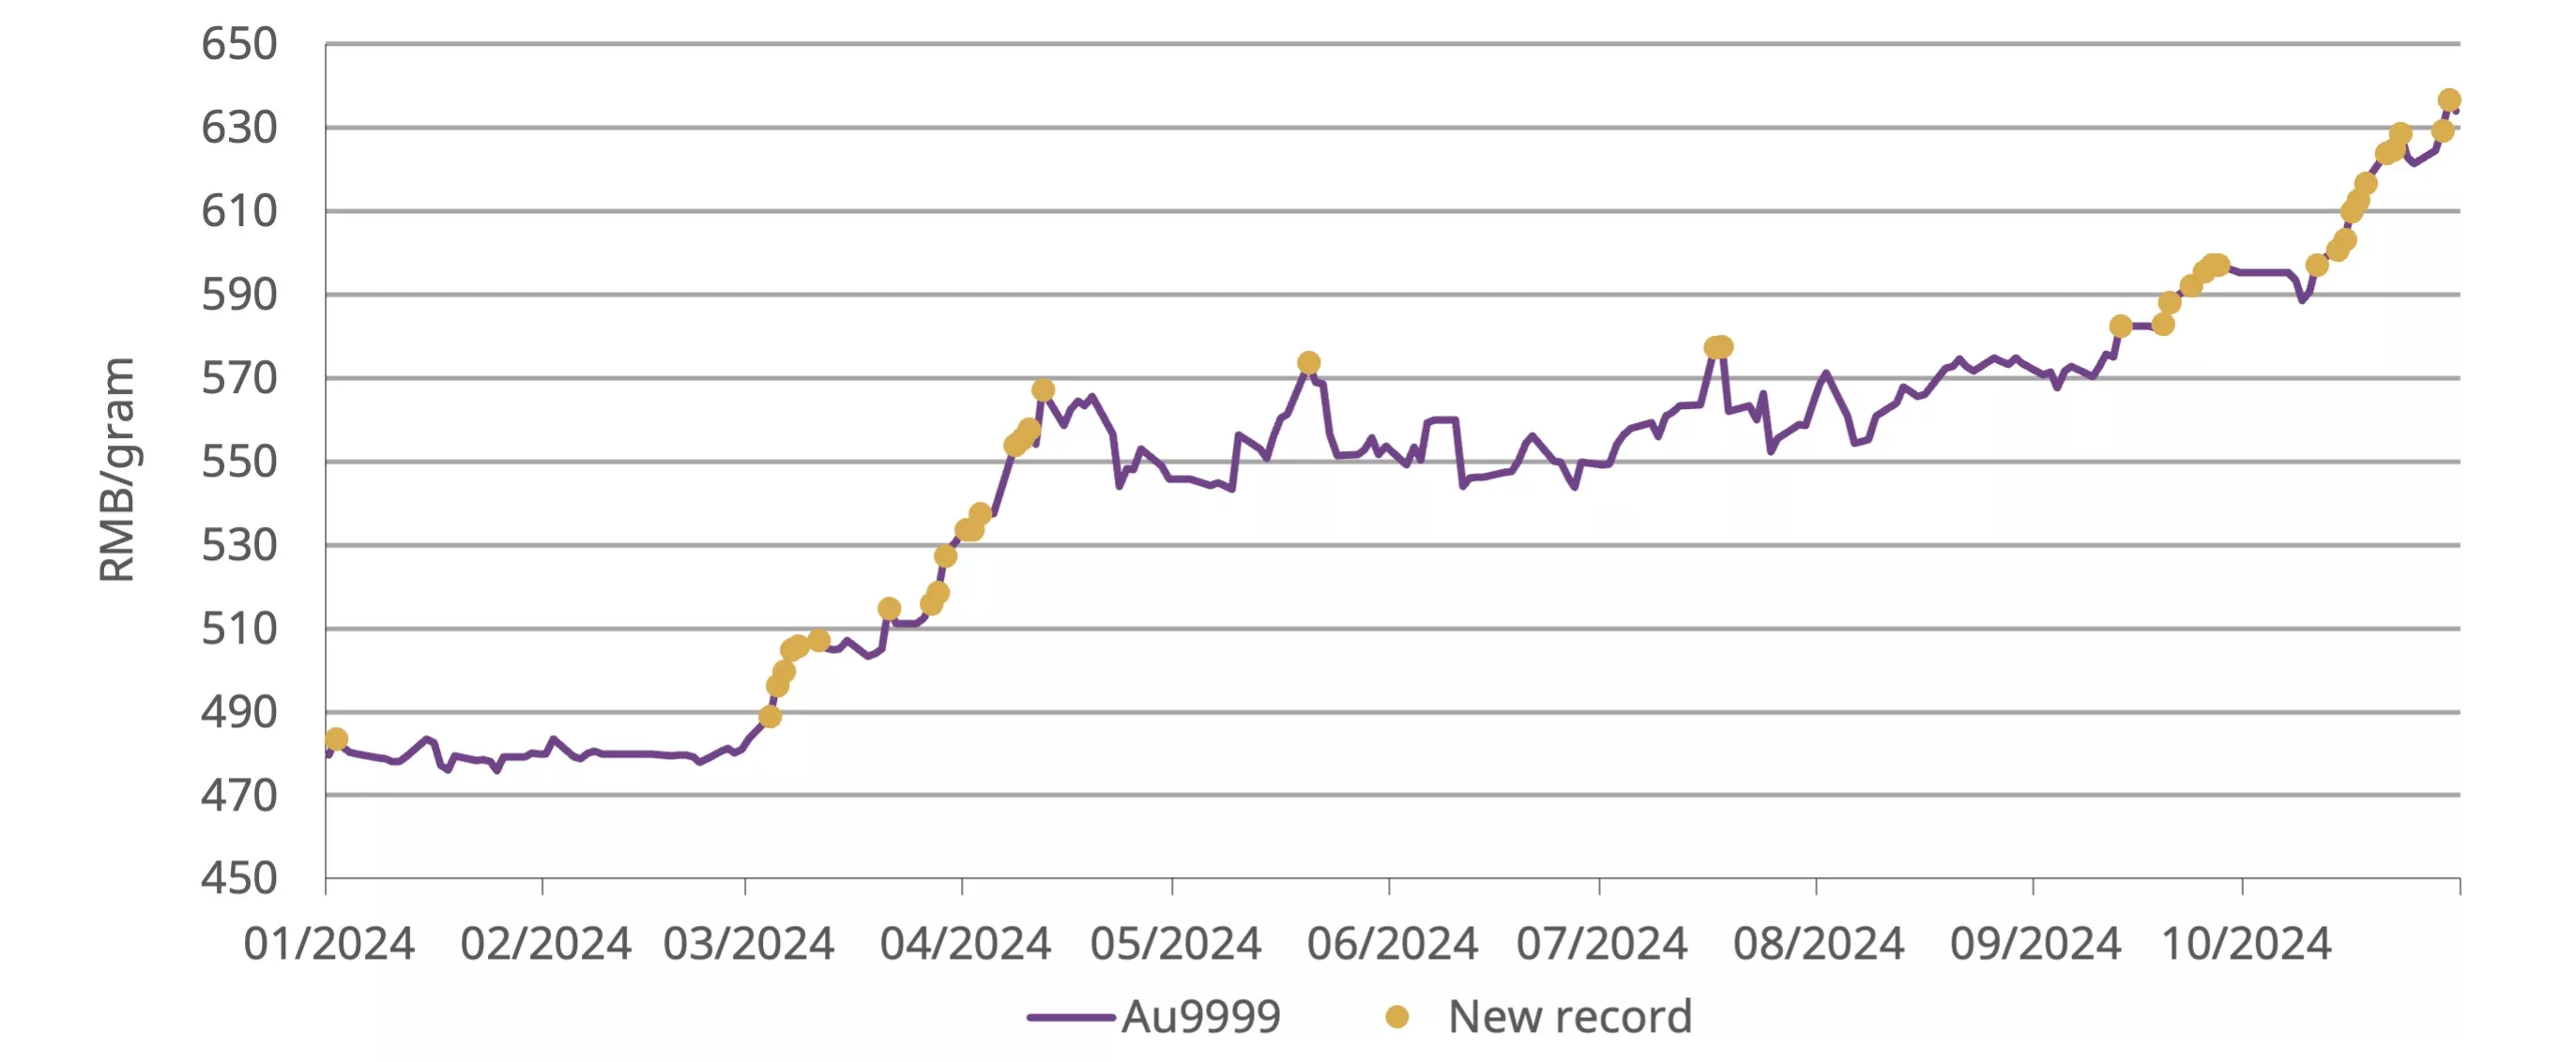
*As of 31 October 2024. Based on the Au9999 as SHAUPM only dates back to 2016. Both are widely used in China as benchmarks with virtually no difference.
Source: Shanghai Gold Exchange, World Gold Council
October’s gold withdrawals from the SGE totalled 107t, a 6% m/m decline and an 11% fall y/y (Chart 3). Historical data shows that China’s wholesale gold demand tends to fall in October following the industry’s active replenishment in September ahead of the early October Golden Week – a traditional peak season for gold consumption.
Although the seasonal m/m drop is the smallest since 2014, continued y/y weakness remains notable. Conversations with gold jewellery market participants indicate softer-than-expected demand boost from the seven-day Golden Week at the beginning of October. The combination of the surging gold price and wallet share competition from travel and other experiential consumption weakened gold jewellery sales, leading to reduced re-stocking needs. The continued Chinese gold price discount compared to its international peer – averaging US$13/oz in October – was also a reflection of weakened demand in general.
Chart 3: Wholesale demand remained weak compared to previous years
Gold withdrawals from the SGE in 2024 and the 10-year average*
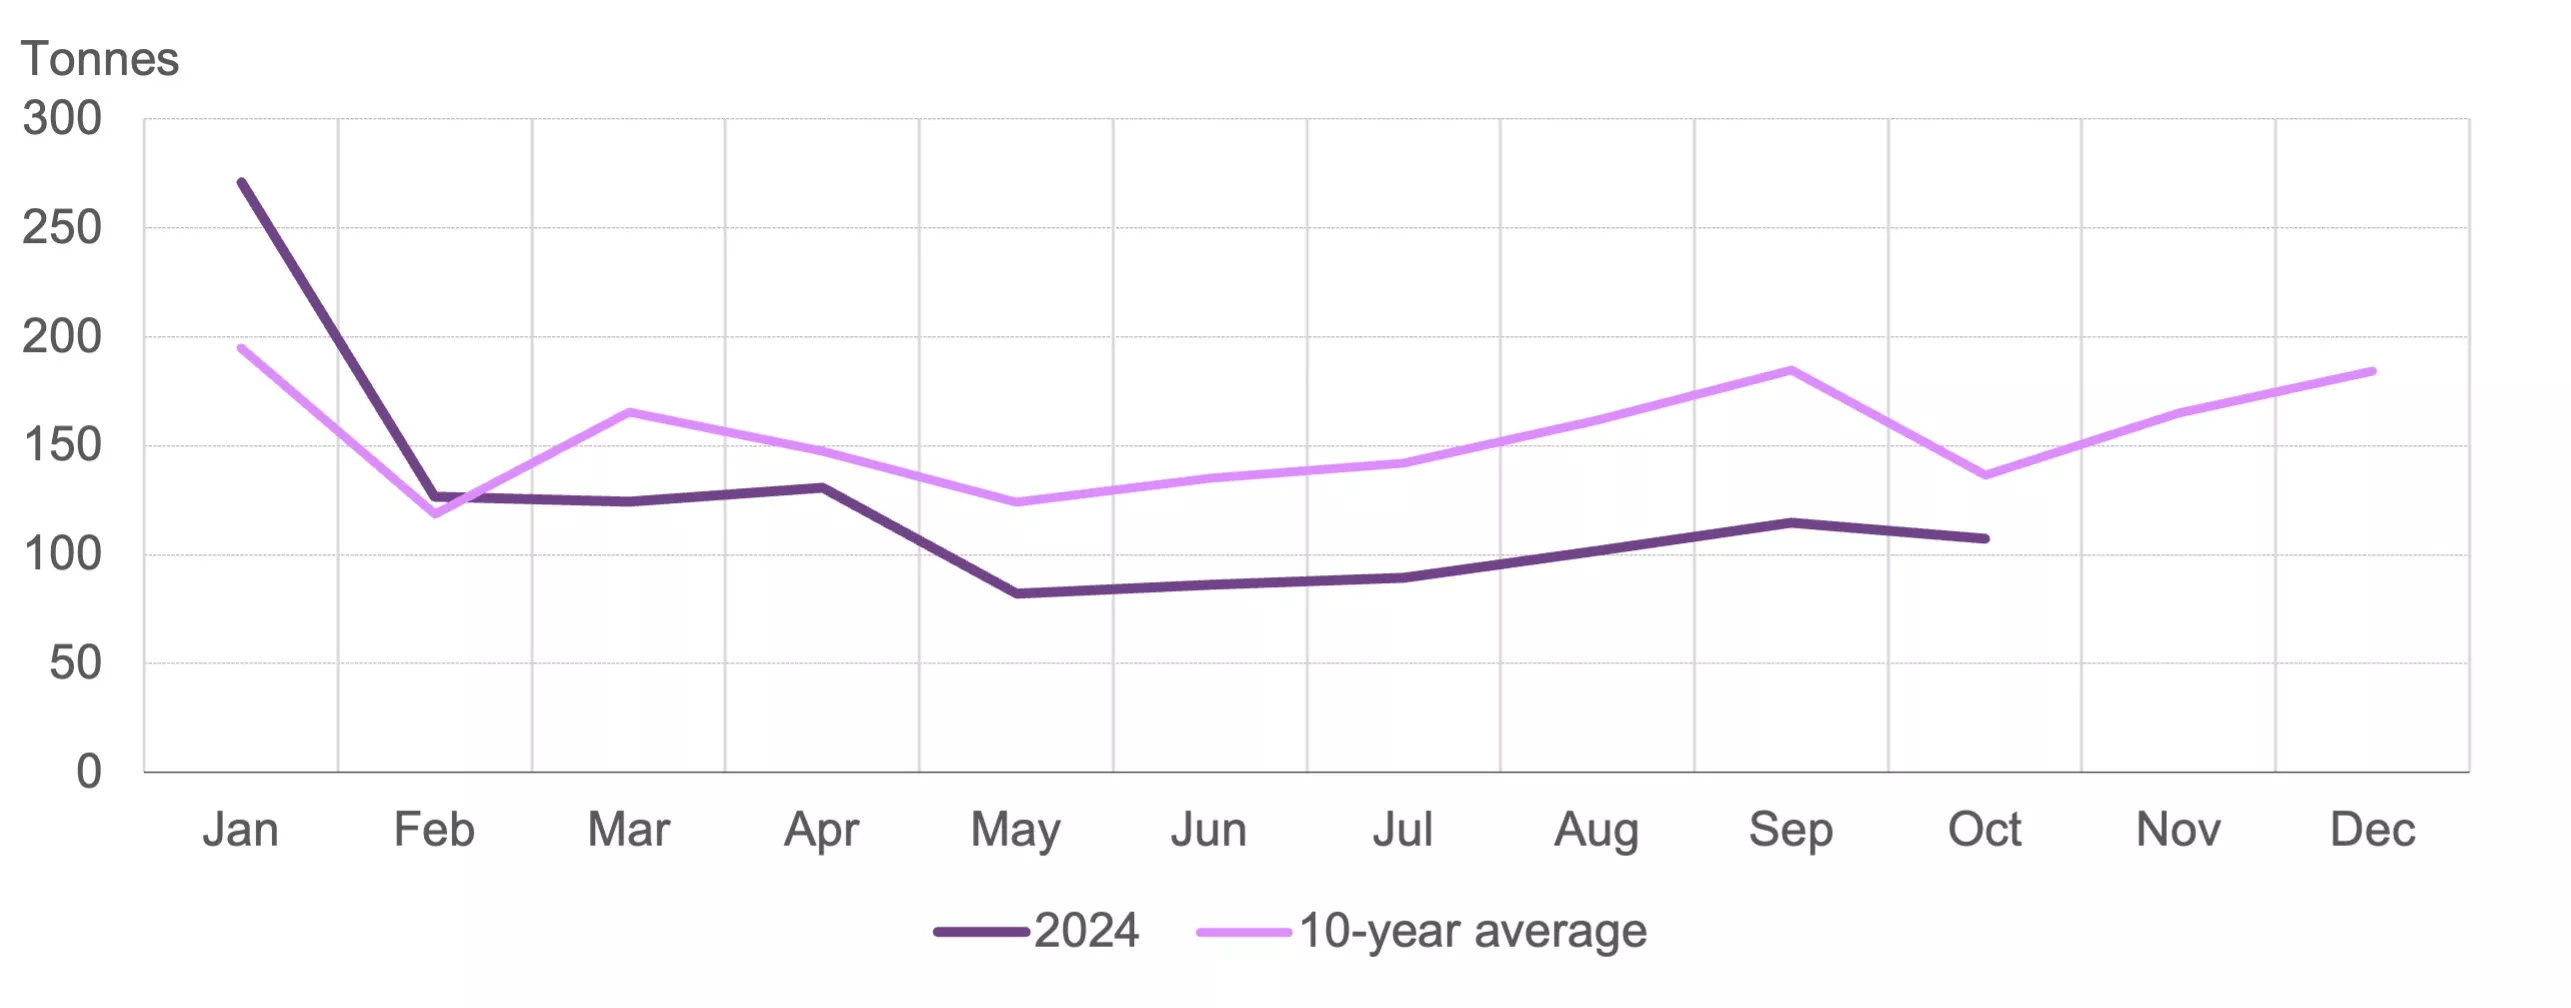
*10-year average based on data between 2014 and 2023.
Source: Shanghai Gold Exchange, World Gold Council
Chinese gold ETFs experienced their strongest month in history (Chart 4), adding RMB13bn (+US$1.9bn). Sizable inflows and a surge in the gold price pushed their total AUM to another record high of RMB69bn (US$10bn). Collective holdings jumped by 21t to 112t, also a new record. October took Chinese gold ETFs’ y-t-d demand to a stunning 51t (+RMB30bn, +US$4.1bn), higher than any annual total in history.
Chart 4: October marks the strongest month for Chinese gold ETF inflows
Monthly Chinese gold ETF inflows and AUM
Source: ETF providers, Shanghai Gold Exchange, World Gold Council
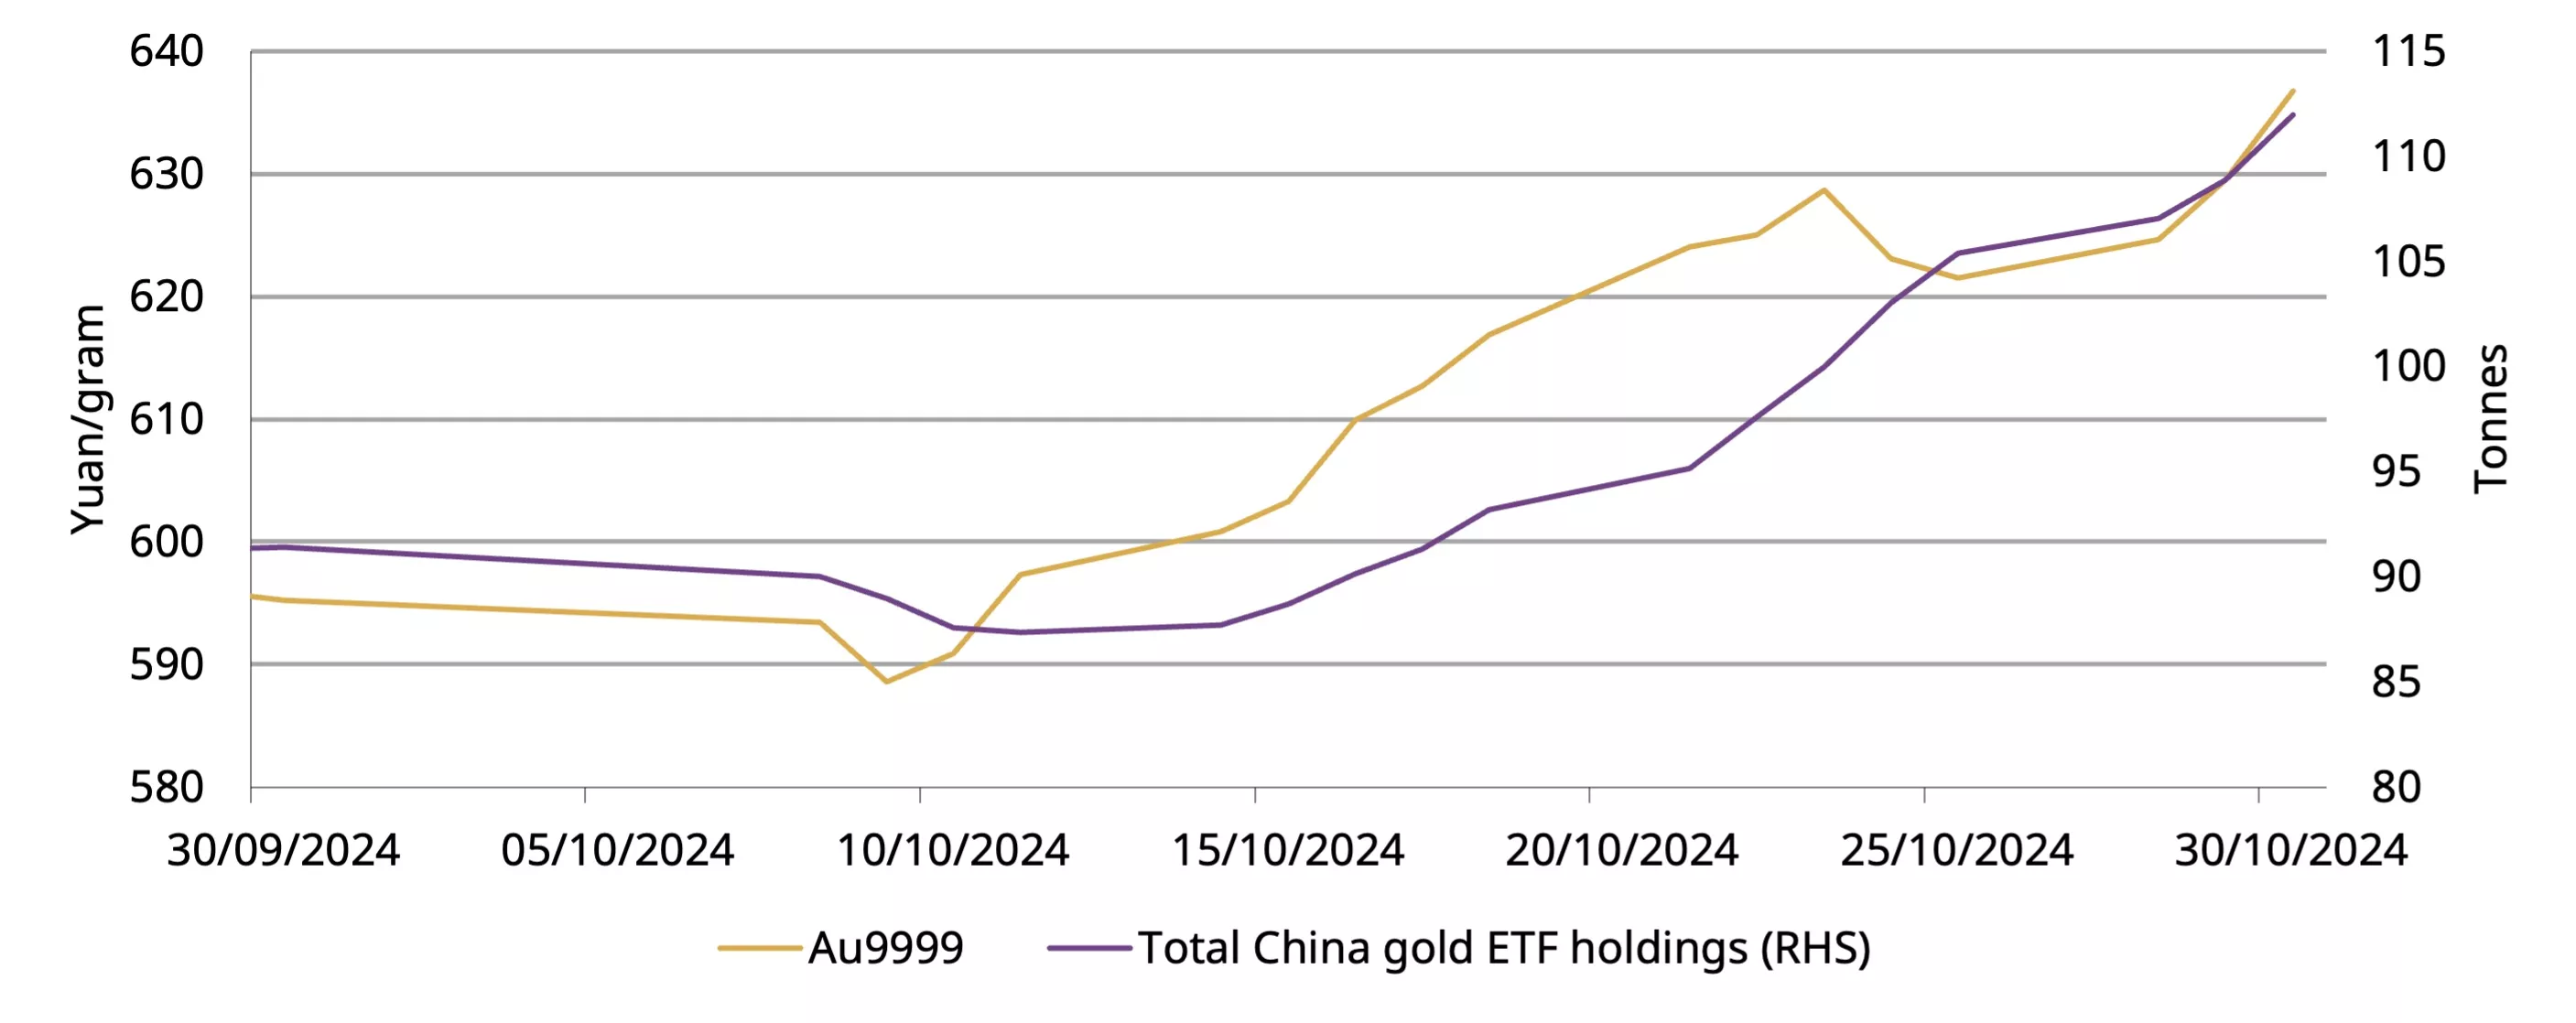
October was a tale of two halves (Chart 5). The first half witnessed outflows as investors turned to equities, which jumped on stimulus announcements before the Golden Week and attracted their attention. But the amplified stock market volatility and the surging local gold price fuelled sizable inflows into gold ETFs in the second half, significantly outpacing earlier losses.
Chart 5: The local gold price trend has been a key determinant of Chinese gold ETF demand in 2024
Daily Chinese gold ETF holdings and the local gold price
Source: ETF providers, Shanghai Gold Exchange, World Gold Council
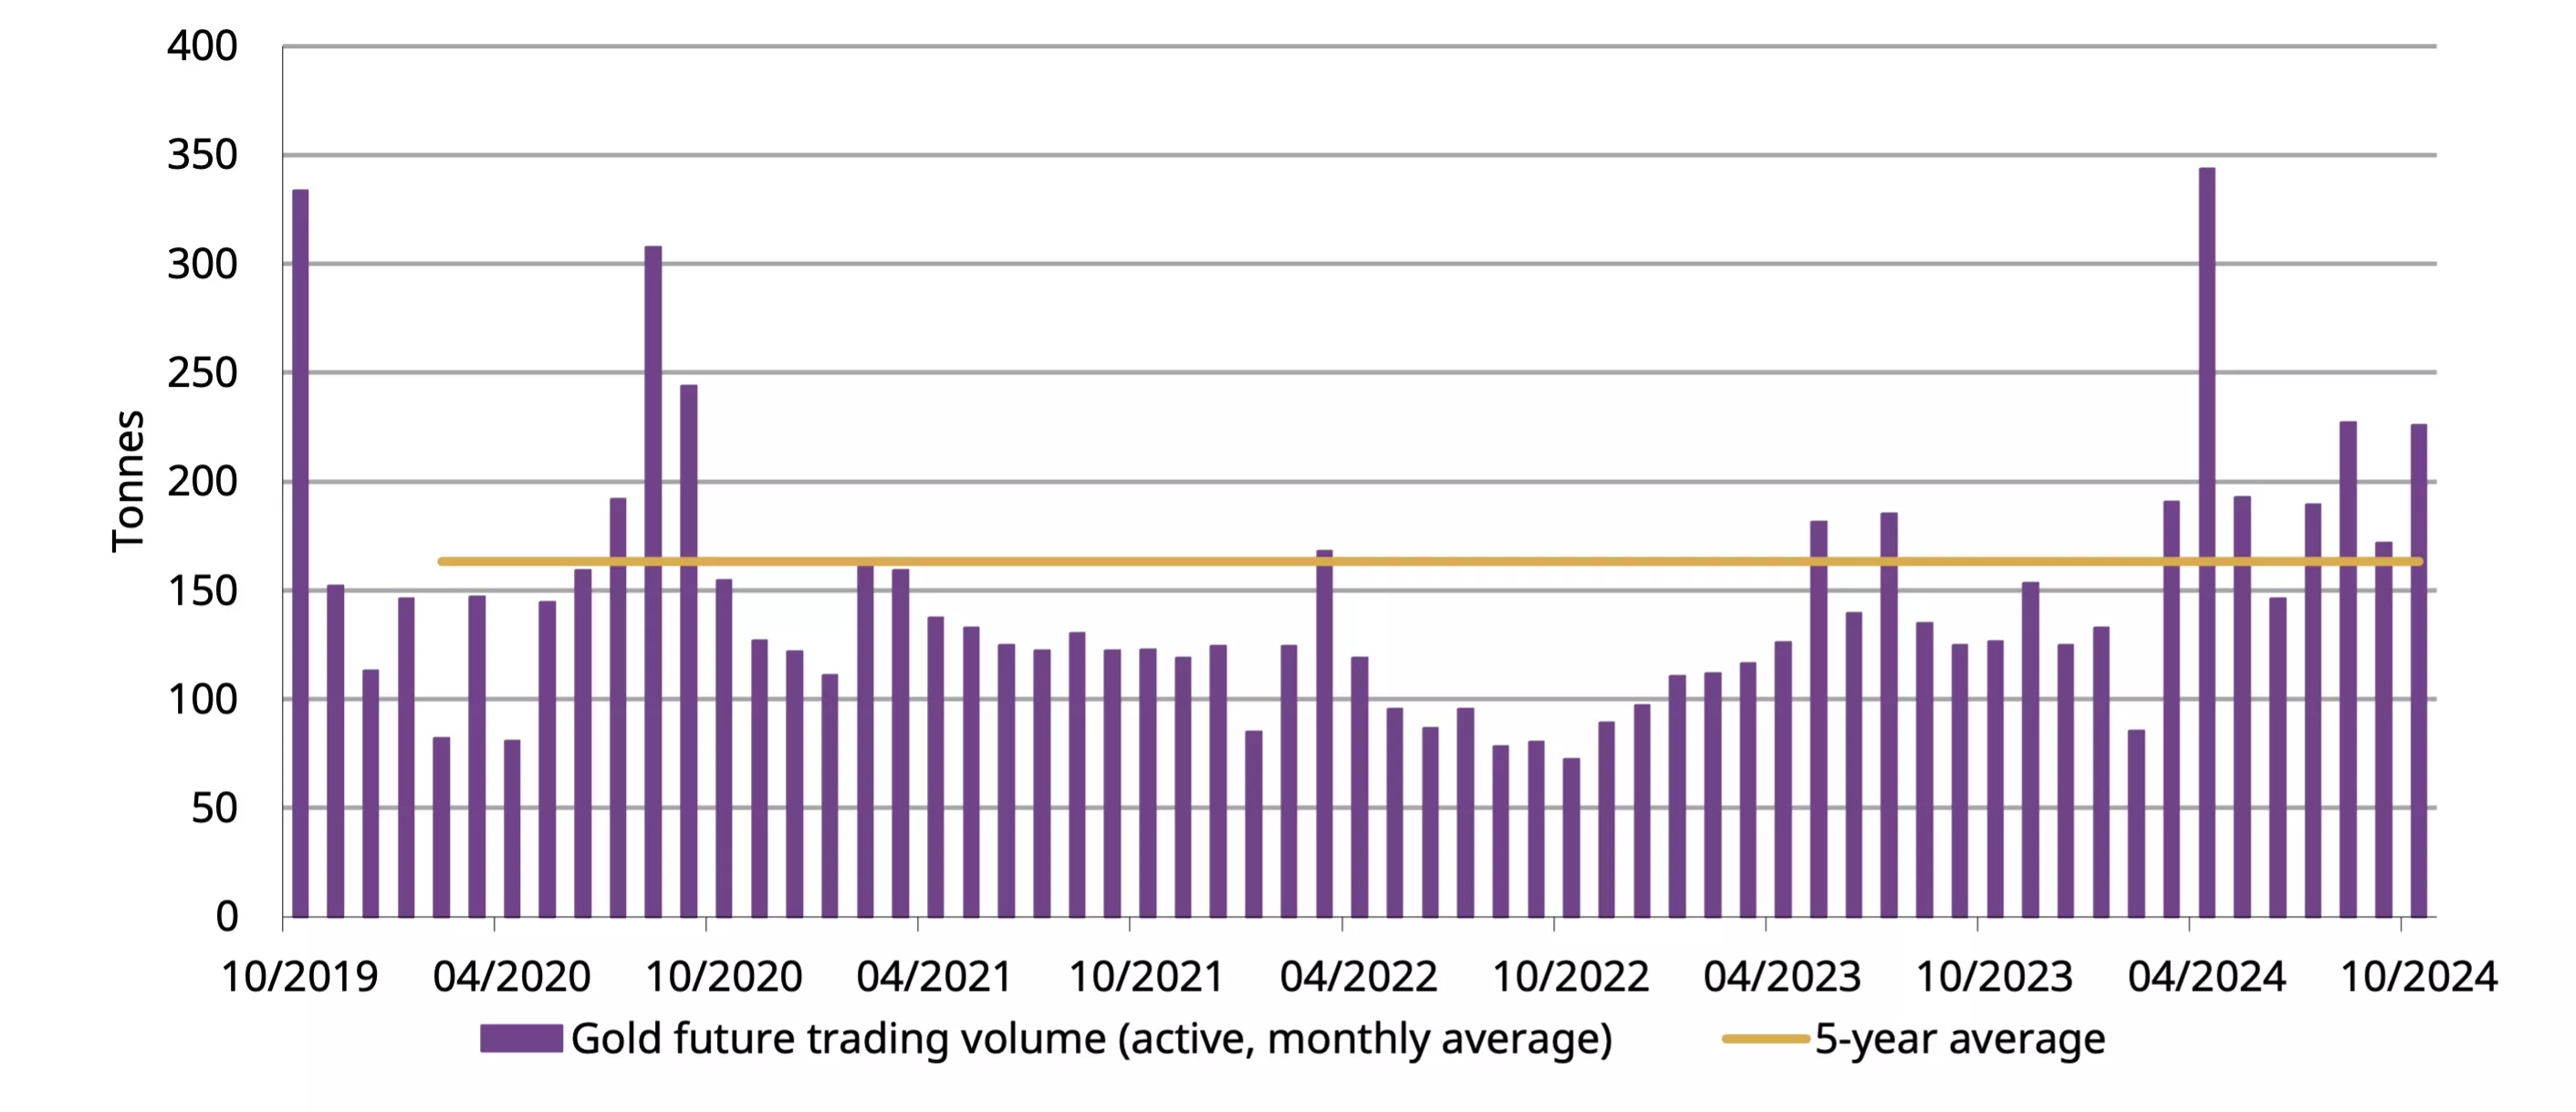
The gold price strength also encouraged gold futures trading (Chart 6). Gold futures at the SHFE were traded 226t/day in October, 32% higher m/m and 39% above the five-year average.
Chart 6: SHFE gold futures trading activities rebounded notably
Monthly and five-year average trading volumes in the active gold futures contract*
*Based on the average daily trading volumes (by month) of the active gold futures contract.
Source: Shanghai Futures Exchange, World Gold Council
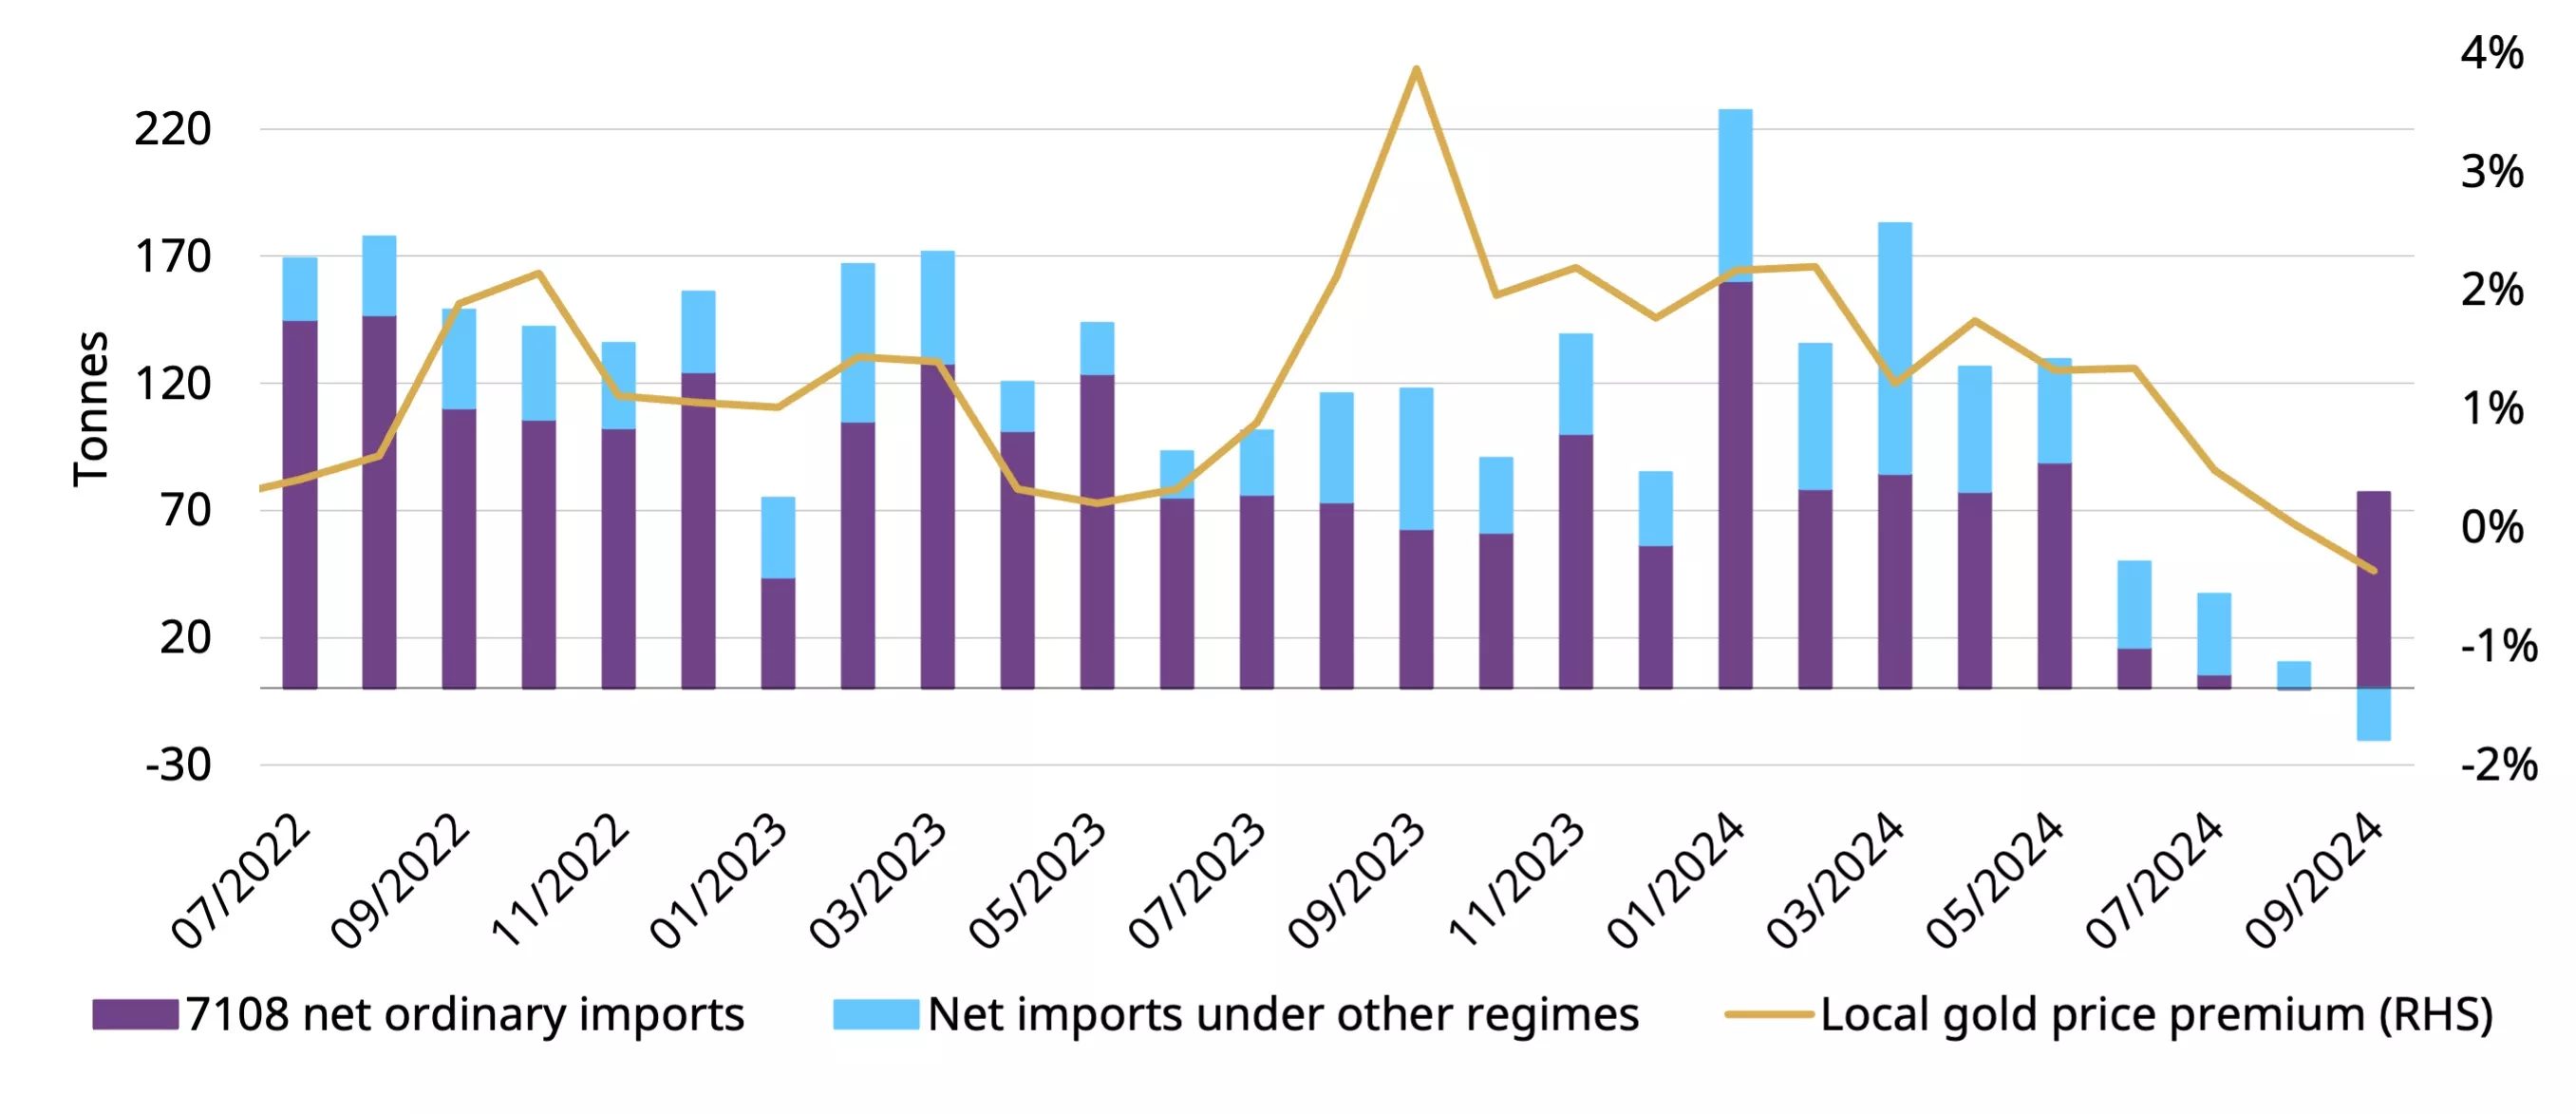
Gold imports rebounded in September, according to the latest update from China Customs (Chart 7). Net gold imports totalled 57t in September, a significant rebound compared to August’s 10t yet remaining well below last September’s 118t. This mirrors trends in China’s wholesale gold demand: there was a 13% seasonal m/m bounce in gold withdrawals from the SGE during September yet the y/y weakness remains considerable. Meanwhile, we believe the prevailing local gold price discount – a result of weak demand – in the month limited gold imports.
Between January and September, net imports totalled 955t, a 14% fall y/y – weak gold jewellery demand constitutes a main factor driving down imports. For more details, please see our recently published Gold Demand Trends.
Chart 7: Gold imports bounced in September*
*Based on all imports under HS code 7108 reported by China Customs and excluding exports.
Source: China Customs, World Gold Council
China’s official gold holdings remained unchanged at 2,264t in October, for the seventh consecutive month. And similar to previous months, as the price continued to surge, gold’s share in total Chinese official foreign exchange reserves climbed to 5.7%. So far in 2024, China’s reported gold purchases total 29t, accumulated between January and April.
For more information on central bank gold purchases, please visit: Central Banks Gold Reserves by Country | World Gold Council.
Footnotes
1For more, see: New adjustment mechanisms to narrow mortgage interest rates - Chinadaily.com.cn and China's major lenders cut mortgage rates, bolstering confidence in recovering property sector.
2For more, see: China’s top 100 developers report better October home sales, other signals remain weak | South China Morning Post.
