A building block approach for expected gold returns
Gold's long-term expected return (GLTER)
A building block approach for expected gold returns
17 October, 2024
We convert our findings into a framework that is perhaps more accessible to investors: the building block approach used widely by practitioners assessing long-term capital market assumptions.
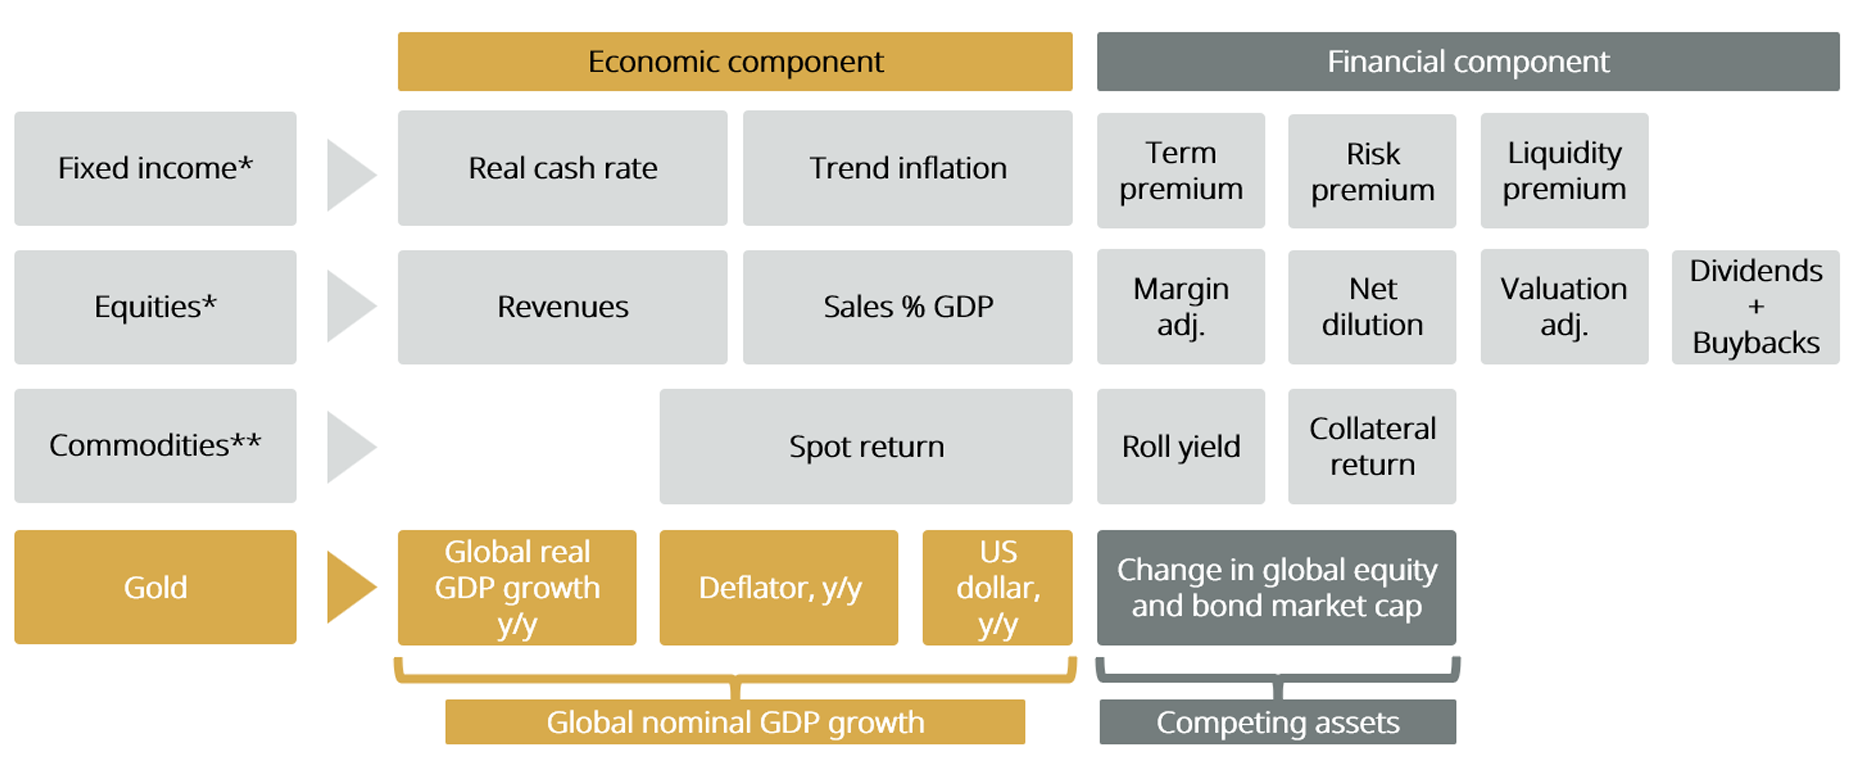
Gold’s price relationship with GDP and the global portfolio can be extended to represent a relationship in return terms. This converts and simplifies these level components into the following relationship:
where rg are annual gold returns, GDP growth is annual global nominal GDP growth and global portfolio growth reflects the growth in market capitalisation of equities and bonds, both in US dollars.
Our analysis suggests that gold’s long-term expected returns are explained by three parts global nominal GDP growth less one-part global portfolio growth.
In Table 2 we use the results of Model (2) to predict an 8.6% annual average return for the period 1971–2024, versus an actual return of 8% over that period. Using external forward estimates for GDP growth and the global portfolio, the model predicts an annual average return of 5.2% for the next 15 years.
Table 2: Gold’s return will be influenced by future expected growth
Historical and modelled gold annualised returns*
Variable
Nominal GDP
Global portfolio
Forecast gold return
Actual return
Coefficient
2.837
-1.079
-
-
1971-2023
7.00%
10.40%
= 8.6%
= 8%
2025-2040
5.24%
8.98%
= 5.2%
-
*Data from 1971 to 2023. Modelled return as described in Table 1. CPI forecast from J.P. Morgan LTCMA 2024. Assuming forecast horizon of 10-15 years. Expected GDP growth from Oxford Economics Global Scenario service baseline forecast. Equity and bond returns from J.P. Morgan LTCMA 2024 using AC World equities and World Government bonds respectively. Growth in outstanding shares and bonds calculated using 5-year average issuance. Source: Bloomberg, BIS, Federal Reserve Bank of St Louis, LBMA Gold Price PM, WFE, World Gold Council. See Appendix A for data descriptions.
The estimated average gold return over the 2025-2040 period in excess of 5% per year is well above that produced by most other models (Figure 3). Specifically, the estimate exceeds common long-term return assumptions such as a zero real return (2.5% nominal in line with expected CPI inflation) over the next 15 years,1 or a gold return equivalent to the risk-free rate (2.9% for short-term US Treasury bills).
This is lower than the historical return we’ve observed, largely down to a lower expected growth in global GDP. However, all asset returns are likely to be impacted. For example, estimates for intermediate US Treasury bonds and World government bonds over the same period are 3.9% and 4.8%, respectively (see Appendix E). And US large cap stocks are expected to grow at a 7% annual rate – below their 20-year return.
This is lower than the historical return we’ve observed, largely down to lower expected growth in global GDP. However, all asset returns are likely to be impacted.
Figure 3: Asset class building blocks
Source: J.P. Morgan, Morgan Stanley, World Gold Council. See Appendix A for data descriptions.
Diversification does not guarantee any investment returns and does not eliminate the risk of loss. Past performance is not necessarily indicative of future results. The resulting performance of any investment outcomes that can be generated through allocation to gold are hypothetical in nature, may not reflect actual investment results and are not guarantees of future results. The World Gold Council and its affiliates do not guarantee or warranty any calculations and models used in any hypothetical portfolios or any outcomes resulting from any such use. Investors should discuss their individual circumstances with their appropriate investment professionals before making any decision regarding any Services or investments. This information may contain forward-looking statements, such as statements which use the words “believes”, “expects”, “may”, or “suggests”, or similar terminology, which are based on current expectations and are subject to change. Forward-looking statements involve a number of risks and uncertainties. There can be no assurance that any forward-looking statements will be achieved. World Gold Council and its affiliates assume no responsibility for updating any forward-looking statements.
Information regarding QaurumSM and the Gold Valuation Framework
Note that the resulting performance of various investment outcomes that can be generated through use of Qaurum, the Gold Valuation Framework and other information are hypothetical in nature, may not reflect actual investment results and are not guarantees of future results. Neither World Gold Council (including its affiliates) nor Oxford Economics provides any warranty or guarantee regarding the functionality of the tool, including without limitation any projections, estimates or calculations.